Articles
- Page Path
- HOME > Korean J Community Nutr > Volume 23(6); 2018 > Article
-
Research Article
- Risk of Metabolic Syndrome according to Intake of White Rice and Kimchi in Korean Adults: based on the 6th Korea National Health and Nutrition Examination Survey, 2013–2015
-
Jin-Su Kim, So Hyun Ahn, Sook Mee Son

-
Korean Journal of Community Nutrition 2018;23(6):525-537.
DOI: https://doi.org/10.5720/kjcn.2018.23.6.525
Published online: December 31, 2018
1Department of Clinical Nutrition, Research Institute & Hospital, National Cancer Center, Goyang 10408, Korea, Internship.
2Department of Food and Nutrition, The Catholic University of Korea, Bucheon, Korea, Instructor.
3Department of Food Science and Nutrition, The Catholic University of Korea, Bucheon, Korea, Professor.
- Corresponding author: Sook Mee Son. Department of Food and Nutrition, 43, Jibong-ro, Bucheon-si, Gyeonggi-do 14662, Korea. Tel: (02) 2164-4318, Fax: (02) 2164-4310, sonsm@catholic.ac.kr
Copyright © 2018 The Korean Society of Community Nutrition
This is an Open-Access article distributed under the terms of the Creative Commons Attribution Non-Commercial License (http://creativecommons.org/licenses/by-nc/3.0/) which permits unrestricted non-commercial use, distribution, and reproduction in any medium, provided the original work is properly cited.
- 1,701 Views
- 8 Download
- 4 Crossref
Figure & Data
REFERENCES
Citations

- Analysis of intake trends of kimchi, fruits and vegetables (1998–2020) and factors associated with the intake (2016–2020): based on the Korea National Health and Nutrition Examination Survey
Jiwon Jeong, Jungmin Park, Yu Kyung Lee, Sung Wook Hong, Sangah Shin
Journal of Nutrition and Health.2023; 56(4): 404. CrossRef - The Relationship Between the Korean Adults Diet Evaluated Using Dietary Quality Indices and Metabolic Risk Factors: Based on the 2016 ~ 2019 Korea National Health and Nutrition Examination Survey
Chong-Yu Ding, Pil-Sook Park, Mi-Yeon Park
Korean Journal of Community Nutrition.2022; 27(3): 223. CrossRef - Nutritional status and metabolic syndrome risk according to the dietary pattern of adult single-person household, based on the Korea National Health and Nutrition Examination Survey
Yu Been Keum, Qi Ming Yu, Jung-Sook Seo
Journal of Nutrition and Health.2021; 54(1): 23. CrossRef - Association of Korean fermented cabbage kimchi consumption with an incidence of metabolic syndrome: 10-year follow-up results of the Korean Genome and Epidemiology Study
Suk Hyeon Seo, Jiyoun Hong, Im Huei Son, Young Hee Han, Taisun Hyun
Journal of Nutrition and Health.2019; 52(6): 569. CrossRef
- We recommend
- Related articles
-
- Self-reported weight change and diet quality in relation to metabolic syndrome among Korean cancer survivors: a cross-sectional study using the Korea National Health and Nutrition Examination Survey 2019–2021
- Analysis of the relationship between sugar intake and cancer prevalence: a cross-sectional study using the 8th Korea National Health and Nutrition Examination Survey
- Trends in growth and nutritional status of Korean toddlers and preschoolers: a cross-sectional study using 2010–2021 Korea National Health and Nutrition Examination Survey data
- Total sugar intake and its contributed foods by age groups in Koreans using the 8th (2019–2021) Korea National Health and Nutrition Examination Survey: a cross-sectional study
- Comparative study on the health and dietary habits of Korean male and female adults before and after the coronavirus disease 2019 pandemic: utilizing data from the 8th Korea National Health and Nutrition Examination Survey (2019–2021)
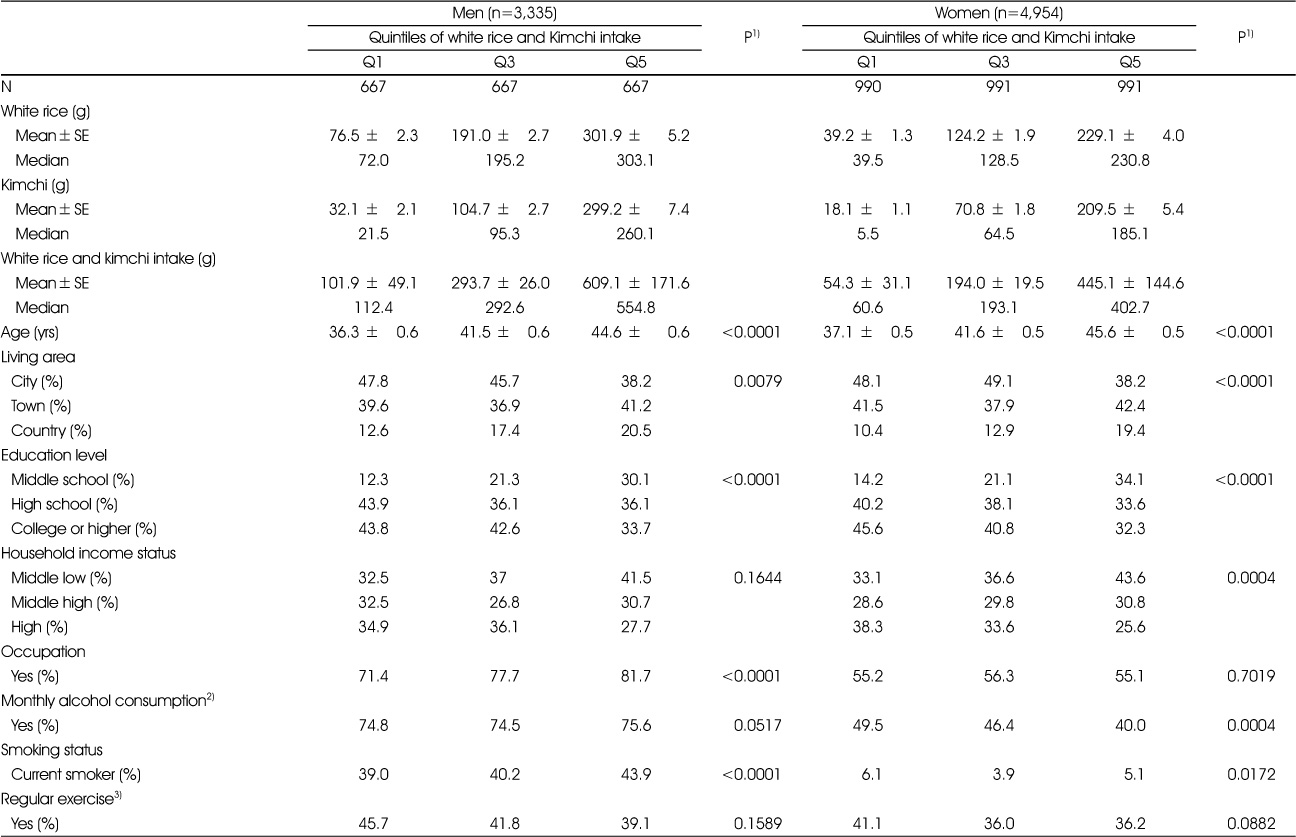
General characteristics of Korean adults according to quintiles of white rice and Kimchi intake
Values are expressed as mean±SE for continuous variables and percentage for categorical variables.
Q1, Q3, Q5 are the lowest, middle, and highest quintiles, respectively.
1) P value is P for trend determined by GLM for continuous variables and P for difference by Chi-square test for categorical variables.
2) Monthly alcohol consumption was defined as percentage of people who drank more than once a month for the past year.
3) Regular exercise was defined as walking at least 30 minutes a day, more than 5 times per week.
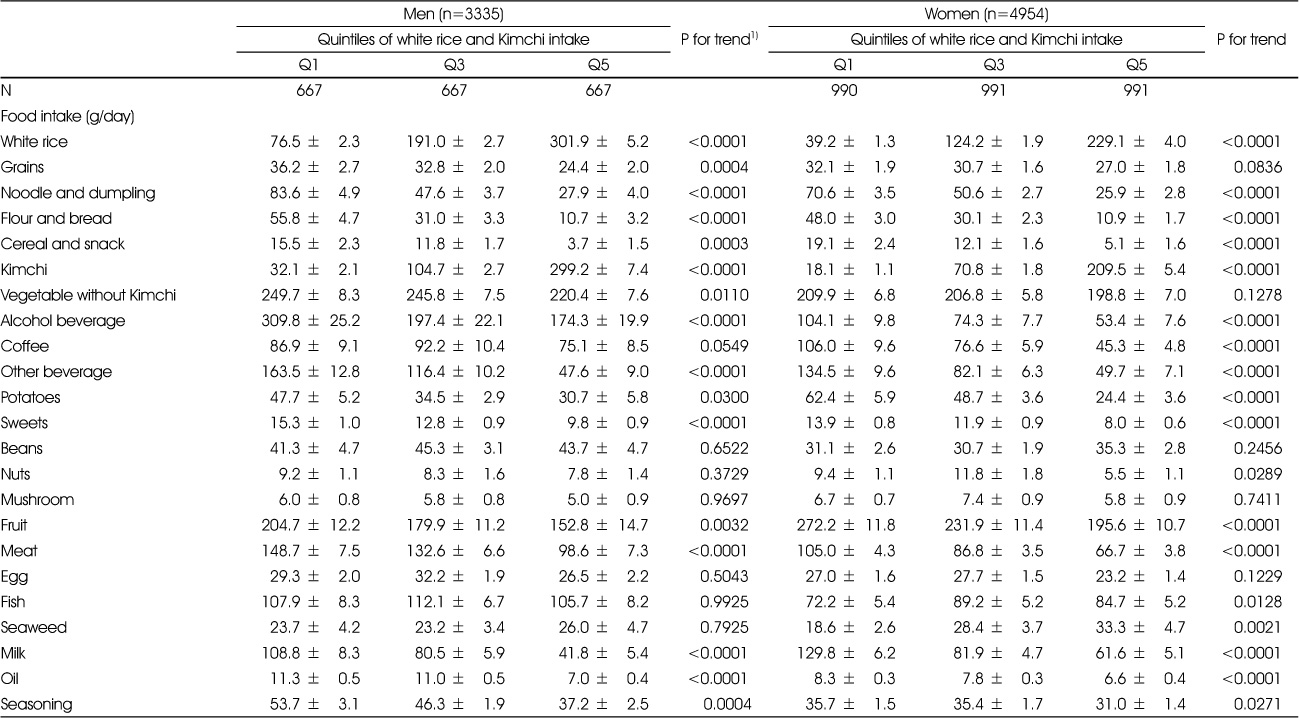
Energy and age adjusted food intake according to quintiles of white rice and Kimchi intake in Korean adults
Values are presented as mean±SE.
Q1, Q3, Q5 are the lowest, middle, and highest quintiles, respectively.
1) P for trend determined by GLM adjusted for energy intake and age..
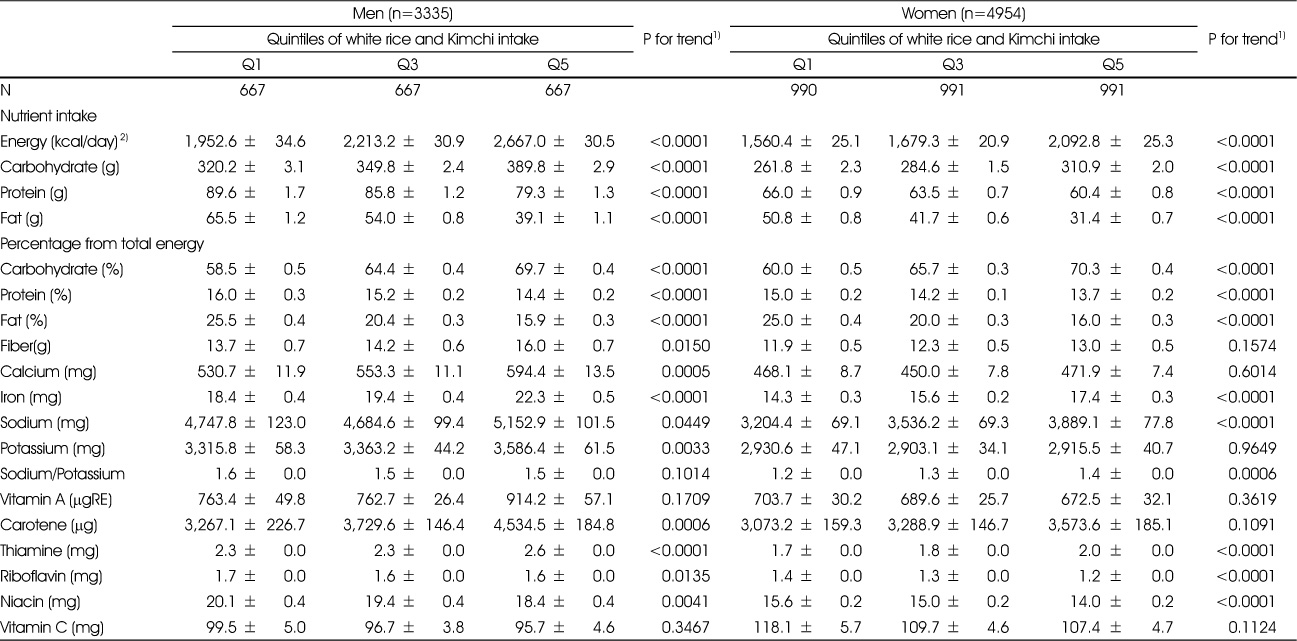
Energy and age adjusted nutrient intake according to quintiles of white rice and Kimchi intake in Korean adults
Values are presented as mean±SE
Q1, Q3, Q5 are the lowest, middle, and highest quintiles, respectively
1) P for trend determined by GLM adjusted for energy intake and age.
2) Mean±SE adjusted for age.
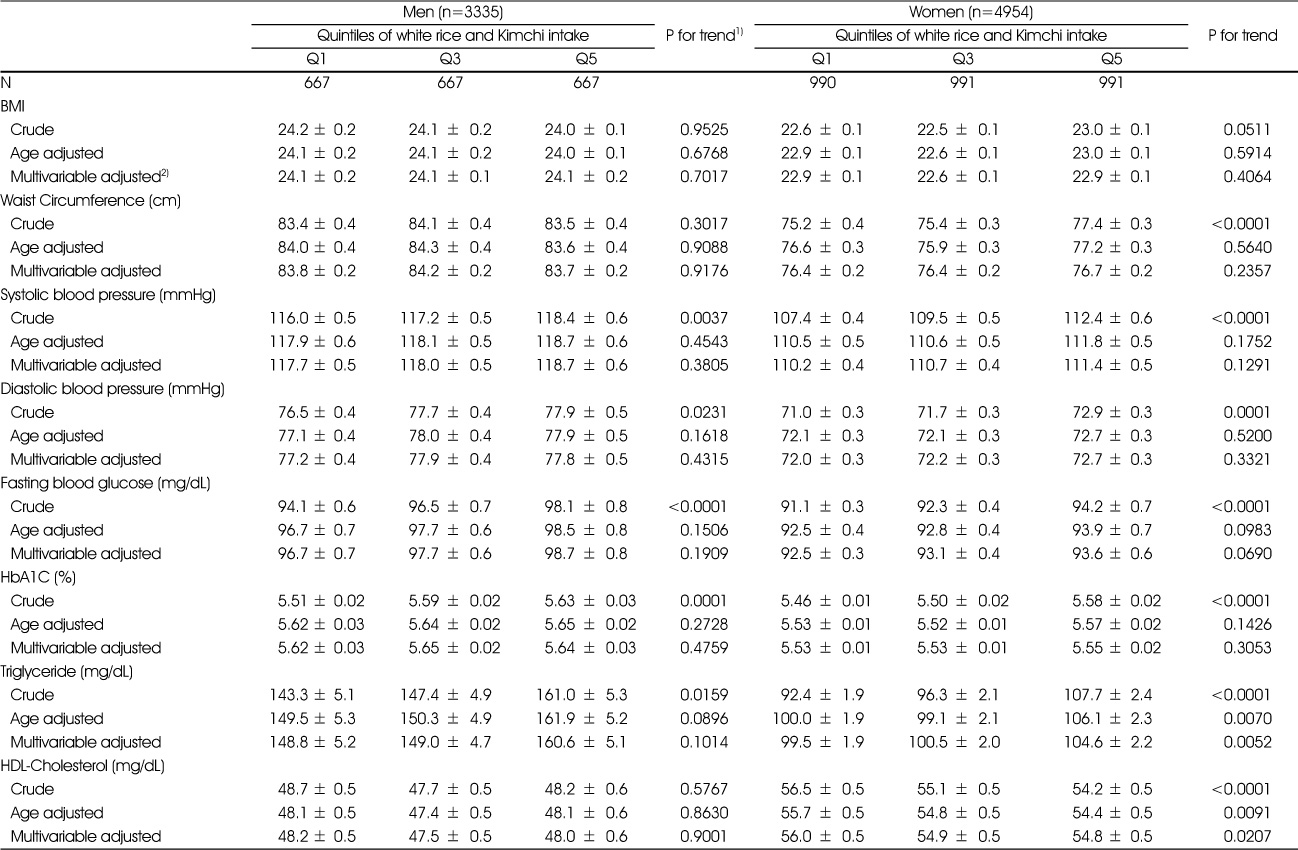
BMI and biochemical indicators by quintiles of white rice and Kimchi intake in Korean adults
Values are means±SE
Q1, Q3, Q5 are the lowest, middle, and highest quintiles, respectively.
1) P for trend determined by GLM
2) Adjusted for age, energy, living area, education level, house income status, occupation, monthly alcohol consumption, smoking status, regular exercise and BMI
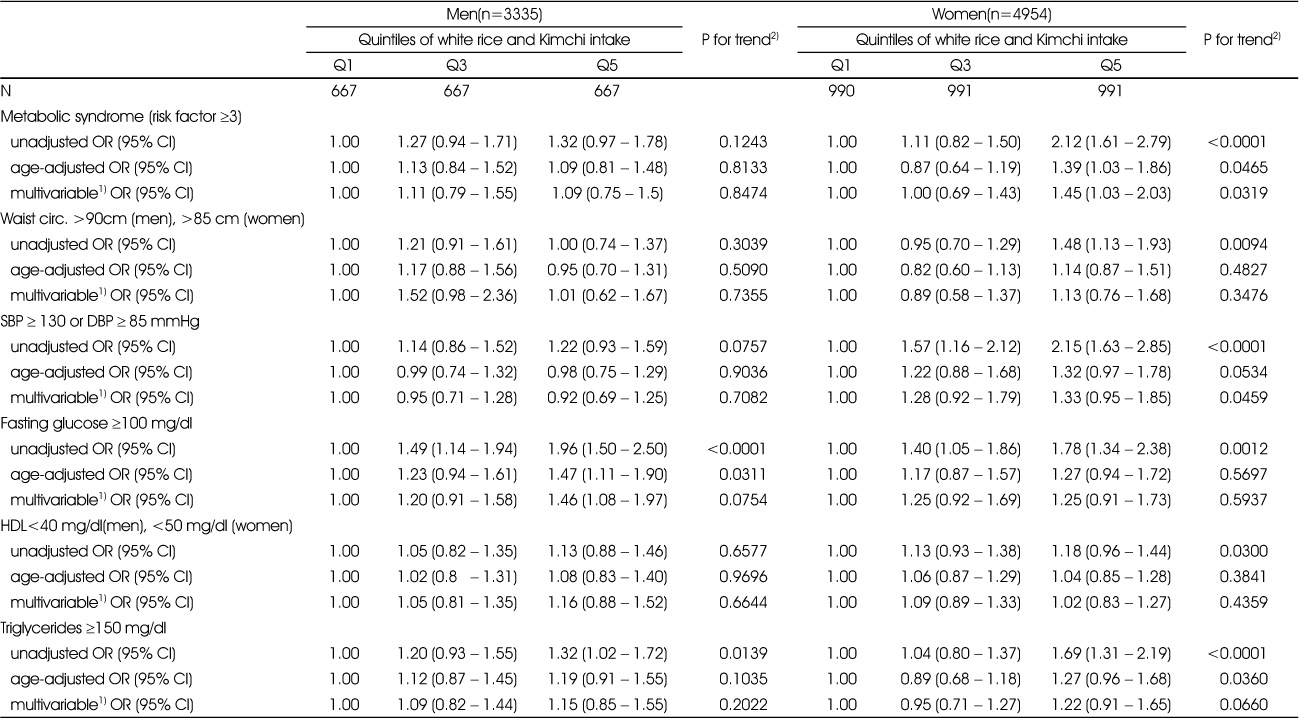
Odds ratios and 95% confidence intervals for metabolic syndrome and components across quintile of white rice and Kimchi intake in Korean adults
1) Adjusted for age, energy, living area, education level, house income status, occupation, monthly alcohol consumption, smoking status, regular exercise and BMI
2) P for trend determined by GLM
Values are expressed as mean±SE for continuous variables and percentage for categorical variables. Q1, Q3, Q5 are the lowest, middle, and highest quintiles, respectively. 1) P value is P for trend determined by GLM for continuous variables and P for difference by Chi-square test for categorical variables. 2) Monthly alcohol consumption was defined as percentage of people who drank more than once a month for the past year. 3) Regular exercise was defined as walking at least 30 minutes a day, more than 5 times per week.
Values are presented as mean±SE. Q1, Q3, Q5 are the lowest, middle, and highest quintiles, respectively. 1) P for trend determined by GLM adjusted for energy intake and age..
Values are presented as mean±SE Q1, Q3, Q5 are the lowest, middle, and highest quintiles, respectively 1) P for trend determined by GLM adjusted for energy intake and age. 2) Mean±SE adjusted for age.
Values are means±SE Q1, Q3, Q5 are the lowest, middle, and highest quintiles, respectively. 1) P for trend determined by GLM 2) Adjusted for age, energy, living area, education level, house income status, occupation, monthly alcohol consumption, smoking status, regular exercise and BMI
1) Adjusted for age, energy, living area, education level, house income status, occupation, monthly alcohol consumption, smoking status, regular exercise and BMI 2) P for trend determined by GLM

 KSCN
KSCN
 Cite
Cite


