Articles
- Page Path
- HOME > Korean J Community Nutr > Volume 24(4); 2019 > Article
-
Research Article
- Children's Food Intake and Nutrition Levels, and Obesity by Maternal Employment: Based on the Korea National Health and Nutrition Examination Survey 2013–2015
-
Geunyeong Kang
 , Yoonna Lee
 , Mihyang UM
 , Seunghee Kye
-
Korean Journal of Community Nutrition 2019;24(4):331-342.
DOI: https://doi.org/10.5720/kjcn.2019.24.4.331
Published online: August 31, 2019
1Seongnam Center for Children's Foodservice Management, Seongnam, Korea, Planning and Operation Team leader.
2Department of food and Nutrition, Shingu College, Seongnam, Gyeonggi, Korea, Professor.
3Nutrition Education Major, Graduate School of Education, Gachon University, Seongnam, Korea, professor.
- Corresponding author: Seunghee Kye. Nutrition Education Major, Graduate School of Education, Gachon University, 1342, Seongnamdaero, Sugeong-gu, Seongam-si Gyeonggi-do, 13120, Korea. Tel: (031) 750-5507, Fax: (031) 750-8683, shkye@gachon.ac.kr
Copyright © 2019 The Korean Society of Community Nutrition
This is an Open-Access article distributed under the terms of the Creative Commons Attribution Non-Commercial License (http://creativecommons.org/licenses/by-nc/3.0/) which permits unrestricted non-commercial use, distribution, and reproduction in any medium, provided the original work is properly cited.
- 859 Views
- 3 Download
- 1 Crossref
Figure & Data
REFERENCES
Citations

- Biochemical Characteristics and Dietary Intake according to Household Income Levels of Korean Adolescents: Using Data from the 6th (2013 ~ 2015) Korea National Health and Nutrition Examination Survey
Yu-Kyeong Kwon, Sook-Bae Kim
Korean Journal of Community Nutrition.2021; 26(6): 467. CrossRef
- We recommend
- Related articles
-
- Analysis of the relationship between sugar intake and cancer prevalence: a cross-sectional study using the 8th Korea National Health and Nutrition Examination Survey
- Trends in growth and nutritional status of Korean toddlers and preschoolers: a cross-sectional study using 2010–2021 Korea National Health and Nutrition Examination Survey data
- Total sugar intake and its contributed foods by age groups in Koreans using the 8th (2019–2021) Korea National Health and Nutrition Examination Survey: a cross-sectional study
- Regional differences in protein intake and protein sources of Korean older adults and their association with metabolic syndrome using the 2016–2019 Korea National Health and Nutrition Examination Surveys: a cross-sectional study
- A comparison of serum lipid concentration by drinking habits based on the 7th Korea National Health and Nutrition Examination Survey (KNHANES VII) : a cross-sectional study
General characteristics of children by maternal employment status
1) N (%), Data was presented as number of subjects and weighted percentage.
P-values from Chi-squared test
2) Mean ± SD, P-values from ANOVA test
Percentages of children skipping breakfast by maternal employment status
1) N (%), Data was presented as number of subjects and weighted percentage.
P-values from Chi-squared test
Total daily food, energy, and three major nutrient intake of children by maternal employment status
1) Mean ± SE, P-values from ANOVA test after adjusting for for gender, age, household income.
2) Post-hoc analysis was performed by Bonferroni method for the adjusted mean of each variable.
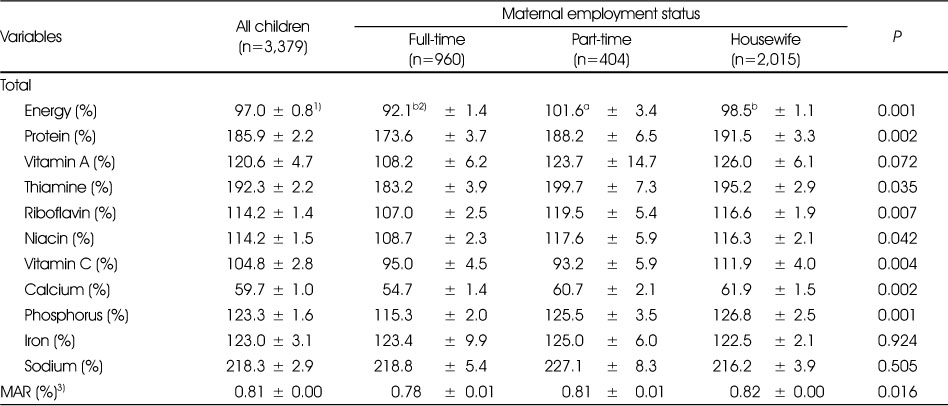
Nutrient intake as a percentage of KDRIs and MAR of children by maternal employment status
1) Mean ± SE, P-values from ANOVA test
2) Post-hoc analysis was performed by Bonferroni method for the adjusted mean of each variable
3) MAR: Mean Nutrient Adequacy Ratio
Percentages of children consuming less than 75% of EER and below EAR by maternal employment status
1) 75% of EER(Estimated Energy Requirement)
2) below EAR(Estimated Average Requirements)
3) % ± SE, P-values from Chi-squared test
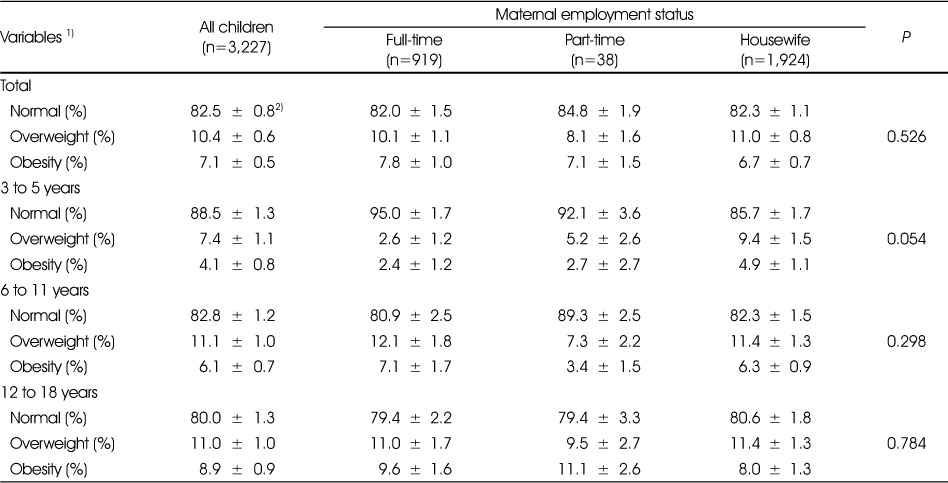
Comparison of weight status among children by maternal employment status
1) Weight status was defined as follows; Obese: ≥ 95th percentile, Overweight: 85~94th percentile, Normal: 5~84th percentile, based on reference data.
2) % ± SE, P-values from Chi-squared test
1) N (%), Data was presented as number of subjects and weighted percentage. 2) Mean ± SD,
1) N (%), Data was presented as number of subjects and weighted percentage.
1) Mean ± SE, 2) Post-hoc analysis was performed by Bonferroni method for the adjusted mean of each variable.
1) Mean ± SE, 2) Post-hoc analysis was performed by Bonferroni method for the adjusted mean of each variable 3) MAR: Mean Nutrient Adequacy Ratio
1) 75% of EER(Estimated Energy Requirement) 2) below EAR(Estimated Average Requirements) 3) % ± SE,
1) Weight status was defined as follows; Obese: ≥ 95th percentile, Overweight: 85~94th percentile, Normal: 5~84th percentile, based on reference data. 2) % ± SE,

 KSCN
KSCN


 PubReader
 Cite
Cite


