
Articles
- Page Path
- HOME > Korean J Community Nutr > Volume 27(1); 2022 > Article
- Research Article 한국 성인의 단백질 섭취량 추이 및 적절성 평가: 2010 ~ 2019년 국민건강영양조사 자료를 활용하여
-
함현지
 , 하경호
, 하경호
- Trends in Dietary Protein Intake and Its Adequacy among Korean Adults: Data from the 2010 ~ 2019 Korea National Health and Nutrition Examination Survey (KNHANES)
-
Hyunji Ham
, Kyungho Ha
-
Korean Journal of Community Nutrition 2022;27(1):47-60.
DOI: https://doi.org/10.5720/kjcn.2022.27.1.47
Published online: February 28, 2022
1제주대학교 식품영양학과, 대학원생
2제주대학교 식품영양학과, 조교수
1Graduate student, Department of Food Science and Nutrition, Jeju National University, Jeju, Korea
2Assistant professor, Department of Food Science and Nutrition, Jeju National University, Jeju, Korea
2제주대학교 식품영양학과, 조교수
1Graduate student, Department of Food Science and Nutrition, Jeju National University, Jeju, Korea
2Assistant professor, Department of Food Science and Nutrition, Jeju National University, Jeju, Korea
-
Corresponding author:
Kyungho Ha, Tel: +82-64-754-3553, Fax: +82-64-725-2539,
Email: kyungho.ha@jejunu.ac.kr
Received: 11 January 2022 • Revised: 22 February 2022 • Accepted: 24 February 2022
- 9,316 Views
- 239 Download
- 19 Crossref
- 0 Scopus
Abstract
Objectives
This study aimed to evaluate dietary protein intake and its adequacy among Korean adults during recent 10 years.
Methods
Based on the 2010 ~ 2019 Korea National Health and Nutrition Examination Survey (KNHANES) data, a total of 51,296 adults aged 19 years old or more who participated in a one-day 24-hr dietary recall were included. Dietary protein intake was estimated as percentages of total energy (% of energy) and grams per body weight (g/kg/ day) and compared with the 2020 Dietary Reference Intakes for Koreans to evaluate the adequacy of protein intake. In addition, proportions of people whose protein intakes were less than the estimated average requirement (EAR) and above the upper limit of the acceptable macronutrient distribution range (AMDR) (> 20% of energy) were calculated according to sociodemographic characteristics.
Results
Protein intake was increased from 14.7% of energy in 2010 to 15.6% of energy in 2019 among Korean adults. However, there was no increase in protein intake relative to the recommended nutrient intake (% RNI) during the recent 10 years. Protein intake relative to the RNI was decreased from 130.2% in 2010 to 121.1% in 2019 (P for trend < 0.0001) among total participants, and a significant decreasing trend was observed in all age groups except for over 65 years old. However, protein intake relative to the RNI was lowest in the elderly (98.6%). Proportions of low protein intake (< EAR) and high protein intake (> AMDR) increased in the past 10 years (P for trend < 0.0001 for all), and these were associated with socioeconomic statuses, such as education and household income levels.
Conclusions
These findings suggest that protein adequacy in Korean adults has not been improved over the past decade compared with recommended levels. Nutritional education and intervention programs should consider different intake levels according to sociodemographic characteristics.
Korean J Community Nutr. 2022 Feb;27(1):47-60. Korean.
Published online Feb 28, 2022.
https://doi.org/10.5720/kjcn.2022.27.1.47
Published online Feb 28, 2022.
https://doi.org/10.5720/kjcn.2022.27.1.47
Copyright © 2022 Korean Society of Community Nutrition
Original Article
한국 성인의 단백질 섭취량 추이 및 적절성 평가: 2010 ~ 2019년 국민건강영양조사 자료를 활용하여
Trends in Dietary Protein Intake and Its Adequacy among Korean Adults: Data from the 2010 ~ 2019 Korea National Health and Nutrition Examination Survey (KNHANES)
Hyunji Ham ,1
and Kyungho Ha2
,1
and Kyungho Ha2
Abstract
Objectives
This study aimed to evaluate dietary protein intake and its adequacy among Korean adults during recent 10 years.
Methods
Based on the 2010 ~ 2019 Korea National Health and Nutrition Examination Survey (KNHANES) data, a total of 51,296 adults aged 19 years old or more who participated in a one-day 24-hr dietary recall were included. Dietary protein intake was estimated as percentages of total energy (% of energy) and grams per body weight (g/kg/day) and compared with the 2020 Dietary Reference Intakes for Koreans to evaluate the adequacy of protein intake. In addition, proportions of people whose protein intakes were less than the estimated average requirement (EAR) and above the upper limit of the acceptable macronutrient distribution range (AMDR) (> 20% of energy) were calculated according to sociodemographic characteristics.
Results
Protein intake was increased from 14.7% of energy in 2010 to 15.6% of energy in 2019 among Korean adults. However, there was no increase in protein intake relative to the recommended nutrient intake (% RNI) during the recent 10 years. Protein intake relative to the RNI was decreased from 130.2% in 2010 to 121.1% in 2019 (P for trend < 0.0001) among total participants, and a significant decreasing trend was observed in all age groups except for over 65 years old. However, protein intake relative to the RNI was lowest in the elderly (98.6%). Proportions of low protein intake (< EAR) and high protein intake (> AMDR) increased in the past 10 years (P for trend < 0.0001 for all), and these were associated with socioeconomic statuses, such as education and household income levels.
Conclusions
These findings suggest that protein adequacy in Korean adults has not been improved over the past decade compared with recommended levels. Nutritional education and intervention programs should consider different intake levels according to sociodemographic characteristics.
Keywords
protein; adequacy; trend; Korean adults
서론
단백질은 근육, 피부, 뼈, 손톱, 머리카락 등의 신체 조직과 호르몬, 항체, 효소의 구성 성분으로써 정상적인 성장과 생리적 기능 및 생명유지에 관여하며, 탄수화물 및 지방과 함께 3대 영양소 중 하나로 체내에 에너지를 공급한다[1]. 최근 고단백질 식사 혹은 단백질 보충이 제지방 증가에 효과가 있다는 연구결과들이 보고됨에 따라 단백질에 대한 관심이 증가하고 있으며[2, 3, 4], 국내 단백질 관련 식품의 시장 규모도 급속히 확대되고 있는 추세이다[5].
보건복지부의 국민건강통계에 따르면 2019년 우리나라 19세 이상 성인의 단백질 섭취량은 75 g/일로 권장섭취량(Recommended Nutrient Intake, RNI) 대비 133.0%였으며, 이는 하루 총 에너지 섭취량의 15.9%를 차지했다[6]. 한국인 영양소 섭취기준의 단백질 에너지적정비율(Acceptable Macronutrient Distribution Range, AMDR)이 7 ~ 20%임을 고려하면[1] 우리나라 성인의 단백질 섭취수준은 전반적으로 적절한 것으로 보이지만, 여전히 섭취 부족에 대한 우려가 존재한다. 2013 ~ 2014년 국민건강영양조사 자료를 활용하여 60세 이상 노인의 단백질 섭취 상태를 평가한 연구는 남성의 30.8%, 여성의 42.6%가 단백질을 단위 체중당 평균필요량(Estimated Average Requirement, EAR) 보다 적게 섭취한 것으로 보고했다[7]. 2016 ~ 2018년 국민건강영양조사에 참여한 65세 이하 성인을 분석한 연구에서는 단백질의 단위 체중당 RNI인 0.91 g/kg/day를 충족하여 섭취한 비율은 남성 66.5%, 여성 58.2%로 나타났다[8]. 그러므로 단백질 섭취실태를 정확히 파악하기 위해서는 단백질의 절대적 섭취량 평가와 영양소 섭취기준과 비교한 적절성 평가가 함께 이루어져야 한다고 사료된다.
한편, 단백질을 과잉으로 섭취할 경우 대사증후군, 제2형 당뇨병, 암 등의 만성질환 위험과 총 사망위험이 증가하는 것으로 보고되어[9, 10, 11, 12] 단백질 섭취의 적절성 평가 시 과잉 섭취에 대한 측면을 함께 고려해야 할 필요가 있다. 이와 더불어 단백질 섭취 적절성의 연도별 변화양상을 파악한다면 단백질에 대한 관심이 전반적으로 증가하는 시점에서 적절한 섭취방안 마련에 도움이 될 것으로 생각된다. 최근 1998 ~ 2018년 국민건강영양조사 자료를 분석한 연구는 한국 성인의 총 단백질 섭취량이 지난 20년간 감소하였지만 최근 10년간은 다시 증가하는 추세임을 보고한 바 있으나[13], 영양소 섭취기준과 비교한 단백질 섭취상태의 변화에 대한 자료는 부족한 실정이다. 따라서, 본 연구는 우리나라 19세 이상 성인의 최근 10년간 단백질 섭취실태의 추이를 한국인 영양소 섭취기준과 비교해 부족과 과잉 측면으로 평가하고, 인구사회학적 요인에 따른 단백질 섭취상태의 차이를 파악하고자 하였다.
연구대상 및 방법
1. 연구자료 및 대상
본 연구는 우리나라 국민의 단백질 섭취 실태의 최근 10년간 추이를 살펴보기 위해 2010 ~ 2019년 국민건강영양조사 자료를 사용했다. 국민건강영양조사란 국민건강증진법에 따라 매년 우리나라 국민 약 1만명에 대한 국가단위 통계를 산출하는 전국 규모의 조사로 크게 검진조사, 건강설문조사, 영양조사로 나뉜다[14]. 본 연구의 대상자는 24시간 회상법 조사에 참여한 19세 이상 성인(n = 57,309)으로 이 중 신장과 체중에 대한 정보가 없는 대상자(n = 4,445), 일일 섭취 열량이 500 kcal 미만이거나 5,000 kcal를 초과하는 대상자(n = 947), 단백질을 전혀 섭취하지 않은 대상자(n = 1), 임신부(n = 312) 및 수유부(n = 308)를 제외하여 총 51,296명을 최종 분석에 포함하였다. 국민건강영양조사는 2014년까지 질병관리본부 연구윤리심의위원회의 승인을 받아 수행되었고(승인번호 : 2010-02CON-21-C, 2011-02CON-06-C, 2012-01EXP-01-2C, 2013-07CON-03-4C, 2013-12EXP-03-5C, 2018-01-03-P-A, 2018-01-03-CA), 2015년부터 2017년까지는 생명윤리법 제 2조 제1호 및 동법 시행규칙 제 2조 제2항 제1호에 따라 국가가 직접 공공복리를 위해 수행하는 연구에 해당하여 연구윤리심의위원회의 심의를 받지 않고 수행되었다가 2018년부터 다시 연구윤리심의위원회의 승인을 받았다. 본 연구는 제주대학교 생명윤리심의위원회의 심의면제를 승인받았다(JJNU-IRB-2021-087).
2. 단백질 섭취량 추정 및 적절성 평가
본 연구는 국민건강영양조사의 1일 24시간 회상법 자료를 사용하여 대상자의 일일 단백질 섭취량을 평가하였다. 단백질 섭취량은 총 에너지에 대한 비율(% of energy)과 단위 체중당 하루 단백질 섭취량(g/kg/day)으로 산출하였다. 총 에너지에 대한 비율은 단백질 섭취량(g)에 4 kcal를 곱한 후 총 에너지 섭취량으로 나누었으며, 단위 체중당 하루 단백질 섭취량은 대상자의 총 단백질 섭취량(g/kg)을 체중(kg)으로 나누어 산출했다.
단백질 섭취의 적절성은 2020 한국인 영양소 섭취기준 중 성인의 단위 체중당 단백질 EAR (0.73 g/kg/day) 및 RNI (0.91 g/kg/day) 와 AMDR (총 에너지의 7 ~ 20%)을 이용하여 평가했다[1]. 개인별 RNI에 대한 단백질 섭취 비율을 산출하였고, 단백질 부족 섭취자의 비율을 평가하기 위해 EAR을 사용해 대상자를 EAR 미만과 EAR 이상 그룹으로 분류하였다. 단백질 섭취 부족과 과잉을 평가하기 위해 단백질 에너지섭취비율을 AMDR과 비교하여 AMDR을 충족한 그룹 (7 ~ 20%)과 충족하지 못한 그룹 (< 7%, > 20%)으로 분류하였다.
또한, 사회경제적 특성에 따른 단백질 섭취 적절성의 차이를 파악하기 위해 대상자의 교육수준, 가구소득수준, 거주지역 유형별로 EAR 미만 그룹과 AMDR 미만 및 초과 그룹의 비율을 평가하였다. 교육수준은 중학교 졸업 이하, 고등학교 졸업, 대학교 졸업 이상으로 분류했으며, 가구소득수준은 월 평균 가구소득 사분위수를 이용하여 하, 중하, 중상, 상으로 분류했다. 거주지역 유형은 대도시, 중소도시, 농어촌으로 분류하였으며, 대도시는 서울, 부산, 대구, 인천, 광주, 대전, 울산, 세종(2016년 이후)의 “동” 지역을 포함하며, 그 외 지역 중 “동” 지역은 중소도시로 정의하였다. “읍/면” 지역은 농어촌으로 정의하였다.
단백질 섭취상태에 따른 단백질 급원식품을 파악하기 위해 대상자가 섭취한 식품을 동물성 식품군과 식물성 식품군으로 구분하여 개인별 1일 총 단백질 섭취량에 대한 각 식품군을 통한 단백질 섭취량의 기여율을 산출하였다. 동물성 급원은 육류(적색육, 가금류, 가공육), 어패류, 우유류, 난류를 포함하고, 식물성 급원은 곡류, 감자·전분류, 채소류, 두류, 종실류, 버섯류, 식물성 양념류, 과일류, 해조류, 당류, 음료류를 포함한다.
3. 통계분석
모든 통계분석은 SAS 9.4 (SAS Institute, Cary, NC, USA)를 사용했으며, 국민건강영양조사의 복합표본설계를 반영하기 위해 분산추정층(kstrata), 집락(cluster), 가중치(weight)를 고려한 분석을 수행했다. 모든 연속형 변수는 평균 ± 표준오차(standard error, SE)로, 범주형 변수는 빈도와 분율(%)로 제시했다. 전체 대상자 및 성별, 연령별 단백질 에너지 섭취비율 및 RNI 대비 섭취비율과 단백질 EAR 미만 및 AMDR 미만/초과 그룹 비율의 연도별 추이는 일반선형모형(general linear model)을 사용하여 검정하였다. 추가적으로 2010년과 2019년의 단백질의 RNI 대비 섭취비율과 EAR 및 AMDR 대비 섭취비율 차이의 유의성을 검정하기 위해 t-test를 실시하였다. 조사기수(제4기 2010 ~ 2012년, 제5기 2013 ~ 2015년, 제6기 및 제7기 1차년도 2016 ~ 2019년) 별 사회경제적 특성에 따른 단백질 섭취 적절성의 차이는 chi-square test를 이용하여 검정했다. 각 조사기수 내의 단백질 EAR 미만 및 이상 섭취자와 AMDR 이내 및 초과 섭취자의 단백질 급원식품 기여율의 차이는 t-test를 이용해 검정하였고, EAR 미만 섭취자와 AMDR 초과 섭취자의 조사기수별 단백질 급원식품 기여율의 차이는 ANOVA를 이용해 검정하였다. 모든 통계검정은 양측검정으로 수행했으며 통계적 유의성은 P < 0.05을 기준으로 하였다.
결과
1. 일반적 특성
연구 대상자의 조사기수별 일반적 특성을 Table 1에 제시하였다. 대상자의 평균 연령은 46.9세로 40 ~ 64세가 전체의 47.0%로 가장 많았으며 65세 이상의 비율은 16.8%이었다. 성별로는 남성 49.9%, 여성 50.1%로 유사한 분포를 보였다. 조사 기수가 높아질수록 교육수준과 가구소득수준은 높아지는 양상을 나타냈으며, 대상자의 대부분인 47.3%가 대도시에 거주하였고 16.6%가 농어촌에 거주하였다.
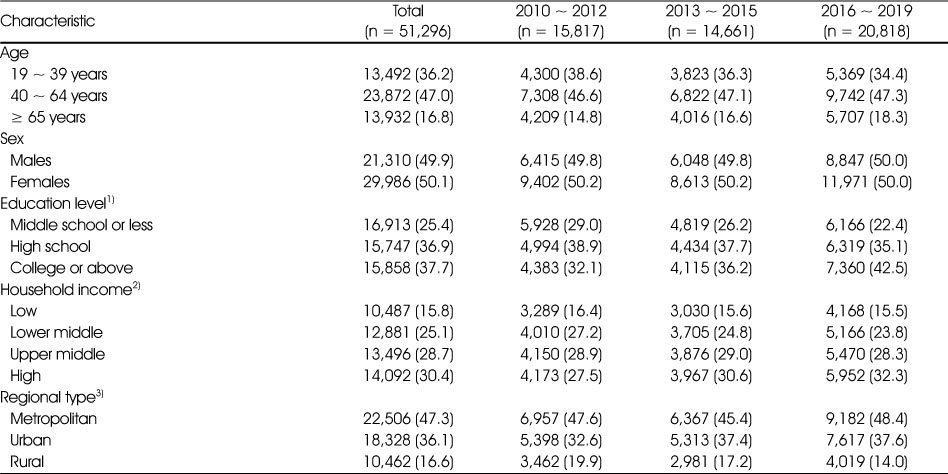
Table 1
Sociodemographic characteristics of Korean adults from the 2010 ~ 2019 KNHANES
2. 최근 10년간 단백질 섭취량 추이
우리나라 19세 이상 성인의 단백질 에너지섭취비율은 2010년 14.7%에서 2019년 15.6%로 최근 10년간 증가하였고, 이와 같은 증가추세는 모든 성별, 연령대에서 확인되었다(P for trend < 0.05 for all)(Fig. 1). 특히, 단백질 에너지섭취비율은 연령이 낮을수록 높았는데, 가장 최근인 2019년의 연령대별 단백질 에너지섭취비율은 19 ~ 39세 16.7%, 40 ~ 64세 15.5%, 65세 이상 14.0%였다. 또한, 모든 연령대에서 남성이 여성보다 단백질 에너지섭취비율이 높았다.
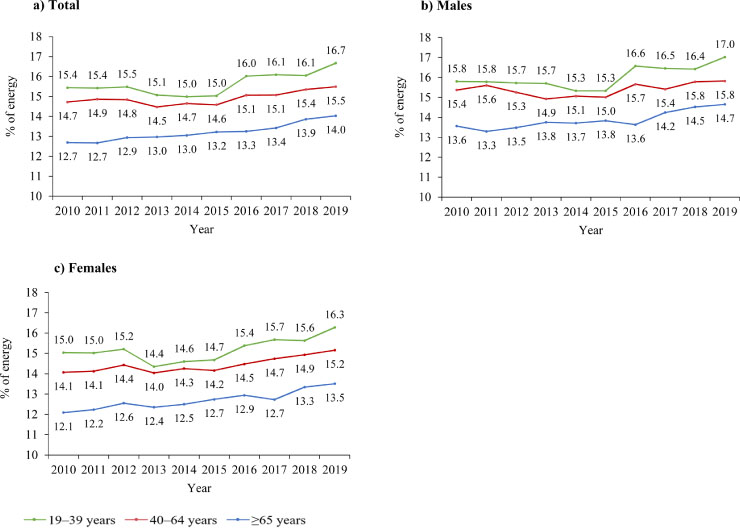
Fig. 1
1) P for trend < 0.05 for all subjects from a general linear model.
Secular trends in protein intake among Korean adults according to sex and age group1).
All the estimates were produced to represent the Korean population using the complex sampling design parameters such as strata, cluster, and sample weight in the PROC SURVEY procedures.
단백질의 RNI 대비 섭취비율의 추이는 Table 2에 제시하였다. 단위 체중당 RNI 대비 단백질 섭취비율은 65세 이상을 제외한 연령대에서 10년 전에 비해 유의하게 감소하였는데, 19 ~ 39세는 2010년 140.5%에서 2019년 134.6%로(P for trend = 0.0096), 40 ~ 64세는 2010년 130.0%에서 2019년 120.6%로(P for trend < 0.0001), 65세 이상은 2010년 102.3%에서 2019년 96.8%로(P for trend = 0.6434)로 감소하였다. 성별로 층화하였을 때, 19 ~ 39세 남성은 2010년 146.9%에서 2019년 138.7%로(P for trend = 0.0086), 40 ~ 64세 남성은 2010년 141.0%에서 2019년 125.2%로(P for trend < 0.0001) 유의하게 감소하였다. 65세 이상의 남성과 각 연령대의 여성에서는 RNI 대비 섭취 비율의 유의한 경향성이 발견되지 않았다. 남녀 모두 65세 이상에서 RNI 대비 섭취비율이 가장 낮았는데, 2019년도 65세 이상 남성의 RNI 대비 섭취비율은 107.1%, 여성은 91.6%였다.
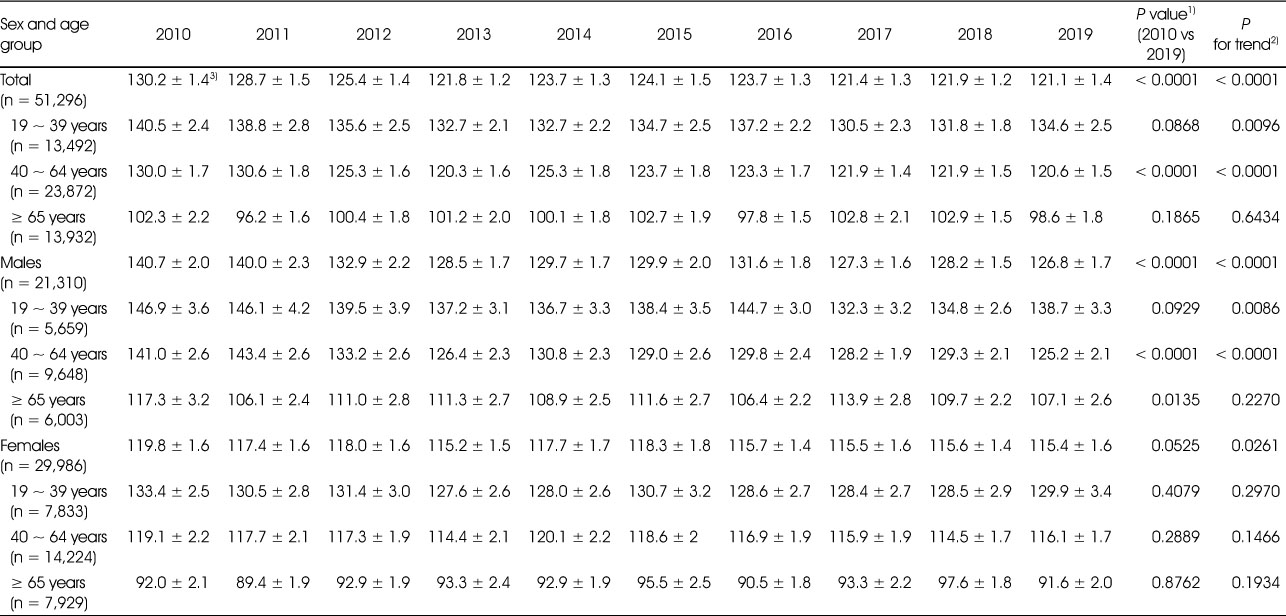
Table 2
Secular trends in protein intake relative to the Recommended Nutrient Intake among Korean adults by sex and age group
3. 최근 10년간 단백질 섭취 적절성 추이
한국인 영양소 섭취기준인 EAR과 AMDR과 비교하여 우리나라 성인의 단백질 섭취 적절성을 평가한 결과를 Table 3에 제시하였다. 전체 대상자 중 단백질을 EAR 미만으로 부족하게 섭취하고 있는 비율은 2010년 21.7%에서 2019년 27.0%로 유의하게 증가하였다(P for trend < 0.0001). 남성의 경우 65세 이상을 제외한 연령대에서 EAR 미만 섭취자의 비율이 최근 10년 동안 유의하게 증가하였고(P for trend < 0.05 for all), 여성의 경우 19 ~ 39세에서 EAR 미만 섭취자의 비율이 유의하게 증가하였으나(P for trend = 0.0173) 65세 이상에서는 EAR 미만 섭취자의 비율이 2010년 45.8%에서 2016년 48.0%로 증가하였다가 2017년부터 다시 감소하는 추세를 보였다. 2019년을 기준으로 단백질을 EAR 미만으로 부족하게 섭취하고 있는 비율은 연령이 높아질수록 증가하여 65세 이상에서 가장 높았다(남성: 34.5%, 여성: 44.7%).
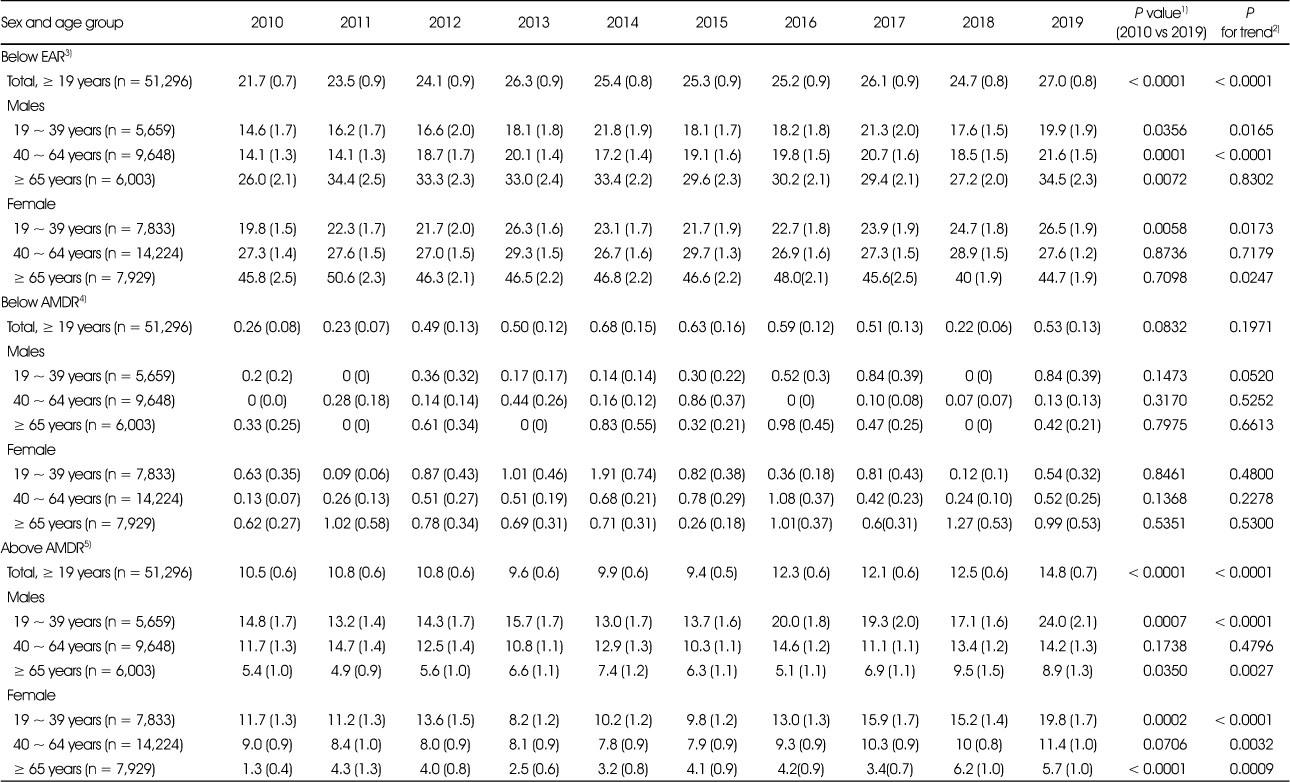
Table 3
Secular trends in percentage of Korean adults below and above DRI standards for protein by sex and age group
단백질을 AMDR의 하한선인 총 에너지의 7% 미만으로 섭취하고 있는 비율은 모든 연도에서 1% 미만이었으며, 2019년에는 0.53%로 10년 전과 비교했을 때 유의한 차이는 없었다. 반면, AMDR의 상한선인 총 에너지의 20%를 초과하여 섭취하고 있는 비율은 2010년 10.5%에서 2019년 14.8%로 유의하게 증가하였으며(P for trend < 0.0001), 40 ~ 64세의 남성을 제외한 성별 모든 연령층에서 유의하게 증가했다(P for trend < 0.05 for all). AMDR 초과 섭취자의 비율은 2019년을 기준으로 연령이 낮아질수록 증가하여 19~39세에서 가장 높았다(남성: 24.0%, 여성: 19.8%).
4. 사회경제적 특성에 따른 단백질 섭취 적절성
조사기수별 사회경제적 특성에 따른 단백질 EAR 미만 섭취자의 비율을 Fig. 2에 제시하였다. 모든 조사기수에서 교육수준과 가구소득수준이 낮을수록 단백질 섭취가 부족한 비율이 높았으며(P < 0.0001 for all), 거주지역의 경우 도시지역에 비해 농어촌지역의 단백질 부족 섭취자의 비율이 다소 높았으나 2013 ~ 2015년에는 유의한 차이를 보이지 않았다.
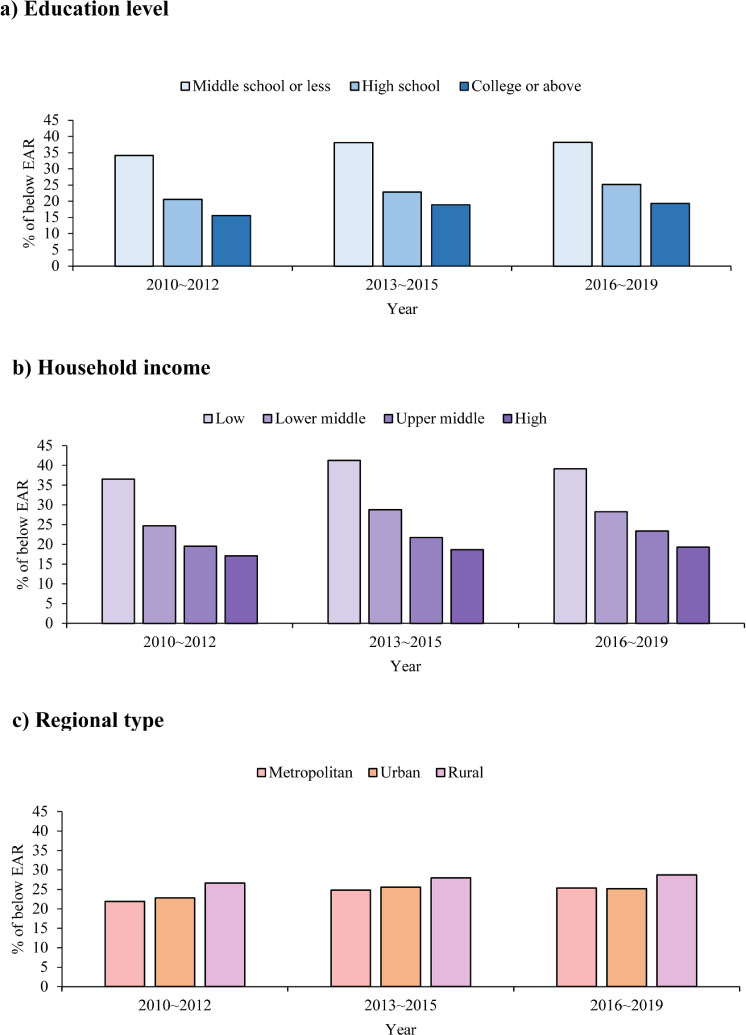
Fig. 2
EAR, Estimated Average Requirement; KNHANES, Korea National Health and Nutrition Examination Survey. 1) P value < 0.0001 for all groups except regional type from chi-square test. P values for regional type are 0.0017 in 2010 ~ 2012, 0.0818 in 2013 ~ 2015, and 0.0270 in 2016 ~ 2019.
Percentage of Korean adults below the EAR for protein intake according to sociodemographic characteristics by KNHANES survey cycle from 2010 to 20191)
All the estimates were produced to represent the Korean population using the complex sampling design parameters such as strata, cluster, and sample weight in the PROC SURVEY procedures.
사회경제적 특성에 따라 단백질을 AMDR을 초과하여 섭취하고 있는 비율을 살펴본 결과 (Fig. 3), 모든 조사기수에서 교육수준과 가구소득수준이 높을수록 단백질을 과잉으로 섭취한 비율이 높았다(P < 0.0001 for all). 거주지역의 경우 2010 ~ 2012년에는 농촌지역의 AMDR 초과 섭취자의 비율이 도시지역에 비해 유의하게 낮았으나, 이후 조사에서는 유의한 차이가 발견되지 않았다. 앞서 단백질을 AMDR 미만으로 섭취한 비율이 전체의 1% 미만이었으므로 사회경제적 특성에 따른 차이를 살펴보지 않았다.
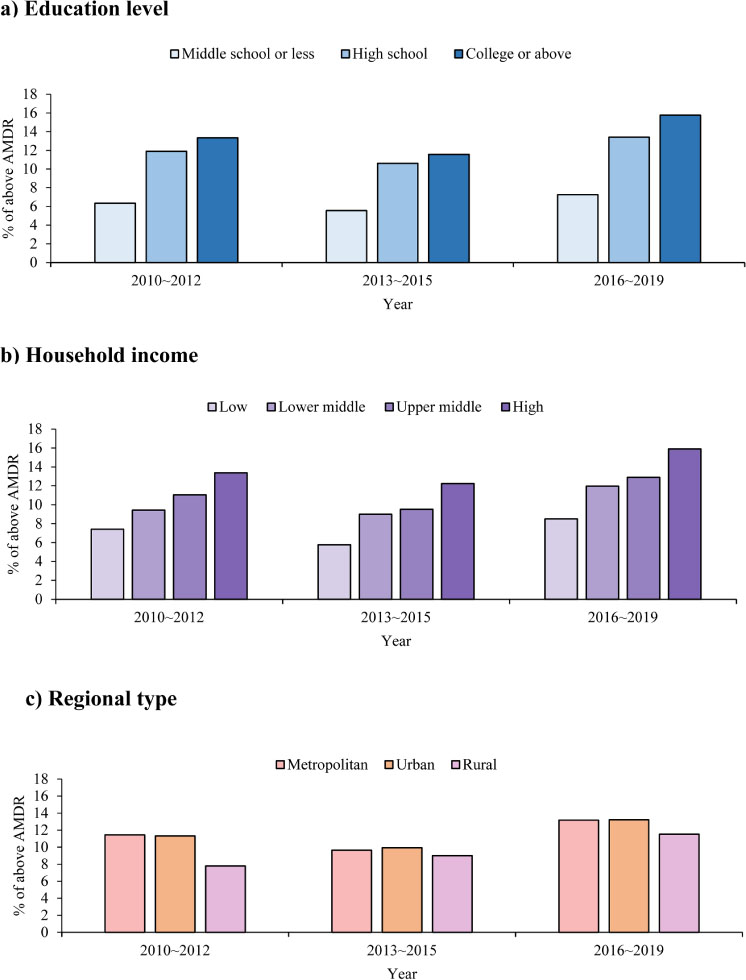
Fig. 3
AMDR, Acceptable Macronutrient Distribution Range; KNHANES, Korea National Health and Nutrition Examination Survey. 1) P value < 0.0001 for all groups except regional type from chi-square test. P values for regional type are 0.0004 in 2010 ~ 2012, 0.6167 in 2013 ~ 2015, and 0.1492 in 2016 ~ 2019.
Percentage of Korean adults above the AMDR for protein intake according to sociodemographic characteristics by KNHANES survey cycle from 2010 to 20191)
All the estimates were produced to represent the Korean population using the complex sampling design parameters such as strata, cluster, and sample weight in the PROC SURVEY procedures.
5. 단백질 섭취 적절성에 따른 단백질의 주요 급원식품군
조사기수별로 단백질 섭취상태에 따라 각 급원식품의 단백질 섭취 기여율을 산출해 Table 4에 제시하였다. EAR 미만 섭취그룹의 식물성 식품군 기여율은 2010 ~ 2012년 72.0%, 2013 ~ 2015년 70.3%, 2016 ~ 2019년 65.6%로 모든 조사기수에서 EAR 이상 섭취그룹의 기여율인 48 ~ 53%에 비해 유의하게 높았다(P < 0.0001 for all). 세부적으로 살펴보면 EAR 미만 섭취그룹의 주요 단백질 급원식품군은 곡류, 육류, 채소류, 어패류이며, 곡류의 기여율은 2010 ~ 2012년 45.2%에서 2016 ~ 2019년 39.5%로 감소하였으나(P < 0.0001) 여전히 가장 주요한 급원이었다. EAR 이상 섭취그룹의 주요 단백질 급원식품은 곡류, 육류, 어패류로 곡류와 육류의 기여율이 2015년까지는 유사하였으나, 2016 ~ 2019년에는 육류의 기여율이 27.8%로 곡류의 기여율(27.1%)에 비해 소폭 높았다.
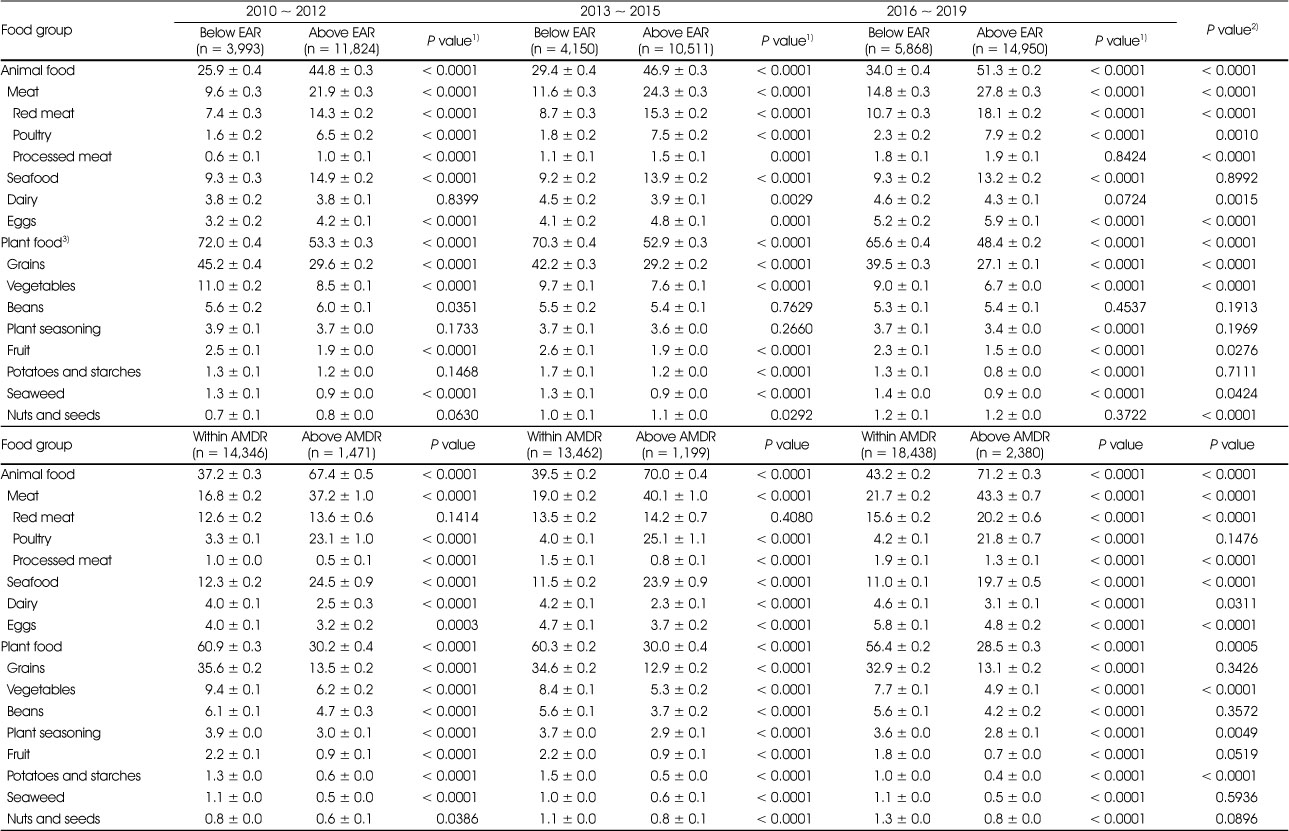
Table 4
Contribution rate of major food groups to protein intake according to protein intake status by KNHANES survey cycle from 2010 to 2019
반면 AMDR 초과 섭취그룹은 총 단백질의 약 70%를 동물성 식품으로 섭취하였는데 동물성 식품의 기여율은 2010 ~ 2012년 67.4%에서 2016 ~ 2019년 71.2%로 증가하였다. 동물성 식품 중 주요급원인 육류의 기여율은 2010 ~ 2012년 37.2%에서 2016 ~ 2019년 43.3%로 높아졌고(P < 0.0001), 특히 적색육과 가공육의 기여율이 조사주기에 따라 증가했다(P < 0.0001 for all).
고찰
본 연구는 우리나라 19세 이상 성인의 단백질 섭취 실태의 변화를 살펴보기 위해 2010년부터 2019년까지의 국민건강영양조사 자료를 이용해 단백질 섭취 적절성을 평가하였다. 단백질 섭취량을 총 에너지 섭취량에서 차지하는 비율로 평가하였을 때 단백질 에너지섭취비율은 모든 성별, 연령대에서 10년 전에 비해 소폭 상승하였고, 특히 최근 5년간 증가추세가 두드러지게 나타났다. 모든 연도에서 단백질 섭취수준은 연령이 낮을수록, 여성보단 남성에서 더 높았다. 그러나, 대상자의 단위 체중당 단백질 섭취량을 RNI와 비교하여 평가한 RNI 대비 섭취비율은 2010년 130.2%에서 2019년 121.1%로 유의하게 감소하였으며 65세 이상과 여성을 제외한 모든 그룹에서 동일한 감소추세가 관찰되었다. 이와 같은 결과는 국민건강통계에서 19세 이상 성인의 RNI 대비 단백질 섭취비율이 2010년 152.9%에서 2019년 133.0%로 감소한 것으로 보고한 것과 유사하였으나[6], 본 연구는 단위 체중당 필요량을 적용하였으므로 RNI 대비 단백질 섭취비율이 낮은 것으로 생각된다.
체중은 단백질 필요량 추정에서 가장 주요하게 고려되는 요소이므로, 본 연구는 성인의 단위체중당 EAR인 0.73 g/kg/일과 비교하여 단백질 섭취량의 적절성을 평가하였다[1]. 본 연구 대상자 중 단백질 EAR 미만 섭취자의 비율은 2010년 21.7%에서 2019년 27.0%로 최근 10년간 유의하게 증가했다. 이러한 증가 추세는 전 연령대의 남성과 19 ~ 39세 여성에서 확인되었으며, 특히 65세 이상 남성에서는 비록 통계적 유의성은 없었으나 2010년 대비 2019년 EAR 미만 섭취자의 증가폭이 8.5%로 가장 컸다. 1970년대 이후 이루어진 식생활의 서구화는 단백질의 주요 급원인 동물성 식품의 섭취량을 증가시켰으나[15, 16], 19 ~ 39세의 젊은 연령대에서도 단백질 섭취부족자의 비율이 증가하고 있다는 본 연구의 결과는 단백질 섭취상태를 향상시키기 위한 노력이 필요함을 시사한다.
본 연구에서 2019년 65세 이상 노인 중 단백질 부족 섭취자의 비율은 남성 34.5%, 여성 44.7%로 청장년층에 비해 높은 수준이었다. 노인의 단백질 섭취 부족문제는 국내 선행연구에서도 보고된 바 있다[7]. 우리나라 노인의 단백질 섭취수준을 인근의 아시아 국가와 비교해보면, 2018년 60세 이상 중국인의 EAR 미만 섭취비율은 44.0%로 우리나라와 비슷한 수준이었다[17]. 반면, 일본의 2012년 국민건강영양조사 자료를 분석한 연구는 65세 이상 노인 중 95% 이상의 단백질 섭취량이 EAR을 충족한 것으로 보고하였다[18]. 중국 성인의 단백질 EAR은 0.9 g/kg/일로 설정되어 있으며[17], 일본 성인의 단백질 EAR은 18 ~ 69세 0.72 g/kg/일, 70세 이상 0.85 g/kg/day으로[19] 우리나라 19세 이상 EAR인 0.73 g/kg/일에 비해 대체로 높게 설정되었다는 점을 고려하면, 우리나라 노인의 단백질 섭취수준이 중국, 일본에 비해 낮음을 확인할 수 있다.
노인의 근감소증(sarcopenia)과 노쇠(frailty)의 예방 및 관리를 위해 충분한 단백질 섭취가 권장되고 있다[20]. 우리나라 19세 이상 성인 16,313명을 대상으로 한 단면연구에서는 단백질 섭취량이 근감소증의 위험과의 음의 연관성이 있었고[21], 50세 이상의 성인 남성 645명과 여성 706명을 대상으로 한 단면연구는 단백질을 권장섭취량 미만으로 섭취하는 65세 이상 성인은 권장섭취량 이상으로 섭취하는 그룹에 비해 골다공증, 근감소증, 비만이 함께 나타나는 osteosarcopenic adiposity의 위험이 5.8배 높았다고 보고하였다[22]. 이에 대한노인병학회와 한국영양학회는 노인의 기존 권장섭취량보다 31.4% 높은 수준인 1.2 g/kg/일의 단백질 섭취를 제안하기도 하였으나[20], 최근 개정된 2020 한국인 영양소 섭취기준은 노인의 단백질 필요량을 높일 만한 과학적 근거가 부족하다고 판단하여 성인과 동일하게 설정하였다[1]. 일본의 경우에도 2015년까지는 70세 이상 노인의 단백질 필요량이 70세 미만에 비해 높게 설정되어 있었으나[19], 2020년에는 성인과 동일하게 적용한 바 있다[1]. 그러므로 노년기 단백질 섭취실태에 대한 지속적인 모니터링과 충분한 단백질 섭취를 위한 효과적인 방안마련이 요구된다.
한편, 연구대상자의 단백질 에너지섭취비율을 AMDR인 7 ~ 20%와 비교한 결과 80% 이상 대부분이 단백질을 AMDR 범위 내로 섭취하고 있었지만, AMDR의 상한선인 총 에너지의 20%를 초과하여 섭취한 비율은 2010년 10.5%에서 2019년 14.8%로 지난 10년간 증가하는 추세를 보였다. Berryman 등[23]이 2011 ~ 2014년 미국의 국민건강영양조사 자료를 분석한 연구에서 미국인의 단백질 AMDR 초과 섭취 비율은 1% 미만으로 본 연구에 비해 현저히 낮았지만, 이는 미국 성인의 단백질 AMDR이 10 ~ 35%로[24] 우리나라 AMDR의 상한선에 비해 1.75배 높은 것을 고려하여 해석할 필요가 있다. 본 연구에서 AMDR의 하한선인 7% 미만으로 섭취하는 사람은 전체의 1% 미만이었는데, 한국인의 단백질 AMDR 하한선은 미국의 AMDR 하한선 10%와 일본 식사섭취기준의 단백질 목표량의 하한선인 13 ~ 15%에 비해 낮았다(상한선은 20%로 동일하나 연령에 따라 높은 하한선을 적용)[24, 25].
한국 성인의 고단백질 섭취비율 증가추세는 전연령대에서 관찰되었지만 특히 19 ~ 39세의 젊은 연령대에서 증가폭과 비율이 가장 높았다(2019년 기준 남성: 24.0%, 여성: 19.8%). 이와 같은 현상에는 단백질 섭취의 중요성에 대한 국민들의 전반적인 인지도 상승과 청장년층의 체중감소 및 체형교정을 위한 고단백질, 고지방 식사의 관심도 증가가 영향을 미쳤을 것으로 사료된다[26]. 본 연구진의 선행연구에서 단백질을 총 에너지의 20% 이상 섭취하는 비율은 연령에 따라 증가하여 19 ~ 29세의 남성에서 26%로 가장 높았으며[26], Lee & Shin[13]은 지난 20년간 20대 성인의 동물성 단백질 섭취량이 현저히 증가하였다고 보고한 바 있다. 본 연구에서 단백질 AMDR 초과그룹은 총 단백질 섭취량의 약 70%를 동물성 식품으로 섭취하였고, 그 중 절반 이상은 육류로부터 섭취하였다. 동물성 식품은 필수아미노산의 주요 급원이나 동물성 단백질의 과도한 섭취는 당뇨, 심혈관질환 등의 만성질환 위험을 높일 수 있으므로[11, 12, 27] 청장년층에서 적정수준의 단백질 섭취와 함께 동물성 및 식물성 단백질 균형 유지에 대한 주의가 요구된다.
다수의 연구에서 사회경제적 수준이 영양상태와 관련이 있음을 보고하였는데[28, 29], 본 연구에서 교육수준 및 가구소득수준이 낮을수록, 농어촌에 거주할수록 EAR 미만 섭취비율이 높았으며 교육수준 및 가구소득수준이 높을수록, 대도시에 거주할수록 AMDR 초과 섭취비율이 높아 사회경제적 수준과 단백질 섭취상태와의 관련성을 확인하였다. EAR 충족 여부에 따른 단백질 급원식품의 차이를 살펴보았을 때 EAR 미만 섭취자에서 곡류의 단백질 기여율은 40 ~ 45%로 가장 높았다. EAR 이상 섭취자에서는 곡류가 27 ~ 30% 정도로 여전히 주요 급원이기는 하지만 육류의 기여율이 22 ~ 28% 정도로 나타났다. 이에 충분한 단백질 섭취를 위해 적정수준의 동물성 단백질 섭취가 필요할 것으로 생각되나, 선행연구에서 교육수준과 소득수준이 낮을수록 동물성 단백질 섭취량이 낮은 것으로 보고되었다[8, 30]. 그러므로 사회경제적 특성에 따른 단백질 섭취수준의 격차 감소를 위해 다양한 식품을 통한 양질의 단백질 섭취방안에 대한 영양교육과 경제적 접근성이 높은 단백질 급원식품들의 마련이 필요할 것이다.
본 연구는 대규모 국가조사 자료를 이용해 최근 10년간 우리나라 19세 이상 성인의 인구사회학적 특성에 따른 단백질 섭취실태를 한국인 영양소 섭취기준의 다양한 지표들과 비교하여 평가한 연구로 의의가 있다. 그러나 본 연구에서 사용한 식사 자료는 하루치의 24시간 회상법 자료이므로 단백질의 일상섭취량을 추정하기에는 제한이 있다. 향후 여러 날 조사를 통해 단백질 섭취량을 추정하여 EAR, AMDR 등과 비교한다면 보다 정확한 단백질 섭취상태를 파악할 수 있을 것이다. 또한, 본 연구는 지난 10년 동안 총 단백질 섭취에 대한 적절성의 변화를 살펴보고자 하였으므로 식품급원별 단백질 섭취상태를 평가하지는 않았다.
요약 및 결론
본 연구는 2010년부터 2019년까지 국민건강영양조사 자료를 이용하여 한국 성인의 최근 10년간 단백질 섭취실태의 추이를 한국인 영양소 섭취기준과 비교해 부족과 과잉 측면으로 평가하고, 인구사회학적 요인에 따른 단백질 섭취상태의 차이를 파악하고자 하였다. 본 연구에 포함된 대상자는 19세 이상 성인 51,296명으로 1일 24시간 회상법 자료를 이용하여 단백질 섭취량을 평가한 결과는 다음과 같다.
1. 최근 10년간 전체 대상자의 단백질 에너지섭취비율은 2010년 14.7%에서 2019년 15.6%로 소폭 증가하였으나 단위 체중당 RNI 대비 단백질 섭취비율은 2010년 130.2%에서 2019년 121.1%로 감소하였다. RNI 대비 단백질 섭취비율은 연령이 증가할수록 낮아져 2019년을 기준으로 연령대별 섭취비율은 19 ~ 39세 134.6%, 40 ~ 64세 120.6%, 65세 이상 98.6%였다. 여성의 RNI 대비 단백질 섭취비율은 모든 연령대에서 동일 연령대의 남성에 비해 낮았으며, 2019년 기준 65세 이상 여성에서 RNI 대비 단백질 섭취비율이 91.6%로 가장 낮았다.
2. 전체 대상자 중 단백질을 EAR 미만으로 섭취하는 비율은 2010년 21.7%에서 2019년 27.0%로 유의하게 증가하였으며, AMDR의 상한선인 20%를 초과하여 섭취하는 비율은 2010년 10.5%에서 2019년 14.8%로 40 ~ 64세의 남성을 제외하고 유의하게 증가하였다. 2019년을 기준으로 EAR 미만 섭취비율은 65세 이상에서 가장 높았고(남성 34.5%, 여성 44.7%), AMDR 초과 섭취비율은 19 ~ 39세에서 가장 높았다(남성 24.0%, 여성 19.8%).
3. 단백질을 부족하거나 높게 섭취하는 비율은 교육수준, 가구소득수준, 거주지역 유형의 사회경제적 특성과 관련이 있었다. 교육수준과 소득수준이 낮을수록, 농촌지역에 거주할수록 단백질을 EAR 미만으로 섭취하는 비율이 높았던 반면 교육수준과 소득수준이 높을수록, 도시지역에 거주할수록 단백질을 AMDR을 초과하여 섭취하는 비율이 높았다.
4. 단백질을 EAR 미만으로 섭취하는 그룹은 총 단백질의 약 70%를 식물성 식품으로 섭취했으며, EAR 이상으로 섭취하는 그룹은 식물성 식품과 동물성 식품의 기여율이 유사하였다. 단백질 AMDR을 초과하여 섭취하는 그룹은 총 단백질의 약 70%를 동물성 식품으로 섭취하였고, 그 중 절반 이상은 육류로부터 섭취한 것으로 확인되었다.
이상과 같은 결과를 통해 최근 10년간 동물성 식품의 섭취 증가에도 불구하고 우리나라 성인의 단백질 섭취수준은 영양소 섭취기준과 비교하였을 때 감소하는 추세였으며, 단백질을 기준보다 낮거나 높게 섭취하는 인구의 비율이 모두 증가했음을 확인하였다. 향후 인구사회학적 특성을 고려한 단백질 섭취실태의 지속적인 모니터링과 함께 단백질 적정섭취와 사회경제적 특성에 따른 단백질 섭취수준의 격차 감소를 위한 효과적인 영양교육 및 영양중재 프로그램의 마련이 필요할 것이다.
Notes
Conflict of Interest:The authors declare no conflict of interest.
Acknowledgments
This work was supported by the National Research Foundation of Korea (NRF) grant funded by the Korea government (MSIT) (No. 2021R1G1A1008495).
References
-
Ministry of Health and Welfare. The Korean Nutrition Society. Dietary reference intakes for Koreans 2020. Sejong: Ministry of Health and Welfare; 2020. pp. 108-149.
-
-
Morton RW, Murphy KT, McKellar SR, Schoenfeld BJ, Henselmans M, Helms E, et al. A systematic review, meta-analysis and meta-regression of the effect of protein supplementation on resistance training-induced gains in muscle mass and strength in healthy adults. Br J Sports Med 2018;52(6):376–384.
-
-
Food Information Statistics System. Food market trend [Internet]. 2021 [updated 2021 Aug 25]. [cited 2022 Jan 10].Available from: https://www.atfis.or.kr/home/board/FB0002.do?act=read&bpoId=3783&bcaId=0&pageIndex=2.
-
-
Ministry of Health and Welfare. 2019 National health statistics. Sejong: Ministry of Health and Welfare; 2020. pp. 129.
-
-
Park HA. Animal and plant protein intake and socioeconomic status in young and middle-aged Korean adults. Korean J Health Promot 2020;20(2):70–78.
-
-
Lee KW, Shin D. Trends in intake and sources of dietary protein in Korean adults, 1998–2018. Br J Nutr. 2021Online ahead of print.
-
-
Ministry of Health, Labour and Welfare. Overview of Dietary Reference Intakes for Japanese (2015) [Internet]. Tokyo: Ministry of Health, Labour and Welfare; 2018 [cited 2021 Jan 10].
-
-
Institute of Medicine. Dietary Reference Intakes for Energy, Carbohydrate, Fiber, Fat, Fatty Acids, Cholesterol, Protein, and Amino Acids. Washington (DC): The National Academies Press; 2005.
-
-
Ministry of Health, Labour and Welfare. Overview of the Dietary Reference Intakes for Japanese (2020) [Internet]. Tokyo: Ministry of Health, Labour and Welfare; 2021 [cited 2022 Jan 10].Available from: https://www.mhlw.go.jp/content/10900000/000862500.pdf.
-
-
Ha K, Song Y. Low-carbohydrate diets in Korea: Why does it matter, and what is next? J Obes Metab Syndr 2021;30(2):222–232.
-
-
Rakić JG, Maksimović M, Janković J, Vlajinac H, Marinković J. Relationship between socioeconomic and nutritional status in the Serbian adult population: A cross-sectional study. Sao Paulo Med J 2018;136(4):310–318.
-
-
Kwon DH, Park HA, Cho YG, Kim KW, Kim NH. Different associations of socioeconomic status on protein intake in the Korean elderly population: A cross-sectional analysis of the Korea National Health and Nutrition Examination Survey. Nutrients 2020;12(1):10
-
 Cite
Cite- Related articles
-
- Changing patterns and related factors of kimchi consumption among Korean adults: a nationwide cross-sectional analysis of the Korea National Health and Nutrition Examination Survey, 2010–2024
- Differences in lunch nutrient intake and nutritional adequacy among Korean older adults by meal site: a cross-sectional analysis of the 2018–2021 Korea National Health and Nutrition Examination Survey data
- Association between nutrient intake and frailty status in Korean older adults: a cross-sectional study using the 9th (2022–2023) Korea National Health and Nutrition Examination Survey
- Comparison of dietary behaviors and nutrient intake by gender and household type among older Koreans: a cross-sectional study using data from the 8th Korea National Health and Nutrition Examination Survey
- Prevalence of coronary artery disease according to lifestyle characteristics, nutrient intake level, and comorbidities among Koreans aged 40 years and older: a cross-sectional study using data from the 7th (2016–2018) Korea National Health and Nutrition Examination Survey
- Ultra-processed food intake and dietary behaviors in Korean adolescents: a cross-sectional study based on the 2019–2023 Korea National Health and Nutrition Examination Survey


