Articles
- Page Path
- HOME > Korean J Community Nutr > Volume 16(4); 2011 > Article
-
Original Article
- Effect of Nutrition Education and Exercise Intervention on Physical and Dietary Patterns of Some Obese Children
- Myoung-Sook Kim, Mee-Sook Choi, Ki-Nam Kim
-
Korean Journal of Community Nutrition 2011;16(4):426-438.
DOI: https://doi.org/10.5720/kjcn.2011.16.4.426
Published online: August 31, 2011
Department of Food and Nutrition, Chungbuk National University, Cheongju, Korea.
1Department of Nursing, Chung Cheong University, Chungbuk, Korea.
- Corresponding author: Ki-Nam Kim, Department of Food and Nutrition, Chungbuk National University, 52 Neasudong-ro, Heungdeok-gu, Cheongiu, Chungbuk 361-763, Korea. Tel: (043) 261-2745, Fax: (043) 261-2742, songhakim@hanmail.net
Copyright © 2011 The Korean Society of Community Nutrition
- 842 Views
- 2 Download
- 9 Crossref
Figure & Data
REFERENCES
Citations

- 코로나19 시기 범불안장애 위험 정도와 영양교육 참여 여부에 따른 우리나라 청소년 식생활 및 건강행태에 관한 연구: 제17차 청소년건강행태조사 자료를 이용하여
수은 윤, 은주 윤
Korean Journal of Food and Cookery Science.2024; 40(2): 96. CrossRef - Delphi Survey for Designing a Intervention Research Study on Childhood Obesity Prevention
Min Jeong Kim, Eunju Sung, Eun Young Choi, Young-Su Ju, Eal-Whan Park, Yoo-Seock Cheong, Sunmi Yoo, Kyung Hee Park, Hyung Jin Choi, Seolhye Kim
Korean Journal of Family Medicine.2017; 38(5): 284. CrossRef - A Study on Dietary Habits and Lifestyle of Girls with Precocious Puberty
Jae-Seong Heo, Hyeok-Soo Moon, Mi-Kyeong Kim
Pediatric Gastroenterology, Hepatology & Nutrition.2016; 19(2): 130. CrossRef - Improvement of Food Habits and Eating Behavior of Children with Obesity and/or Precocious Puberty by Nutrition Education Monitoring
Jae Hee Kim, Yun Jin Choi, Hyun Sook Lim, Jong Hee Chyun
Journal of The Korean Society of Food Culture.2015; 30(1): 129. CrossRef - Effects of Dietary Education on Elementary Children in After-school Program in Seoul
Kyung-Hee Kim
Journal of the Korean Society of Food Culture.2014; 29(2): 222. CrossRef - Perception of environment-friendly foods and satisfaction with school meals among students, their parents, and nutrition teachers at elementary schools in the Jindo area, Jeonnam
Moon-Hee Jung, Moon-Jeong Chang, Sun-Hee Kim
Journal of Nutrition and Health.2013; 46(4): 369. CrossRef - A Study on Classification of Obesity for Koreans based on the Articles in the Korean Journal of Community Nutrition - Articles Enlisted from 1996 to 2011 -
Youngnam Kim
Korean Journal of Community Nutrition.2013; 18(5): 525. CrossRef - Actual Status of School Dietitians' Recognition and Use of Superior Agricultural Products in Daegu
Jin A Jang, Sun Woo Ahn, Mi-Kyung Choi
Korean Journal of Community Nutrition.2012; 17(3): 312. CrossRef - The Effects of Participation in Exercise and Nutrition Education Program on Physical Fitness, Dietary Habits and Nutrition Intake Status for Adolescents
Ok Hyun Kim, Jin Kyung Park
The Korean Journal of Obesity.2012; 21(3): 158. CrossRef
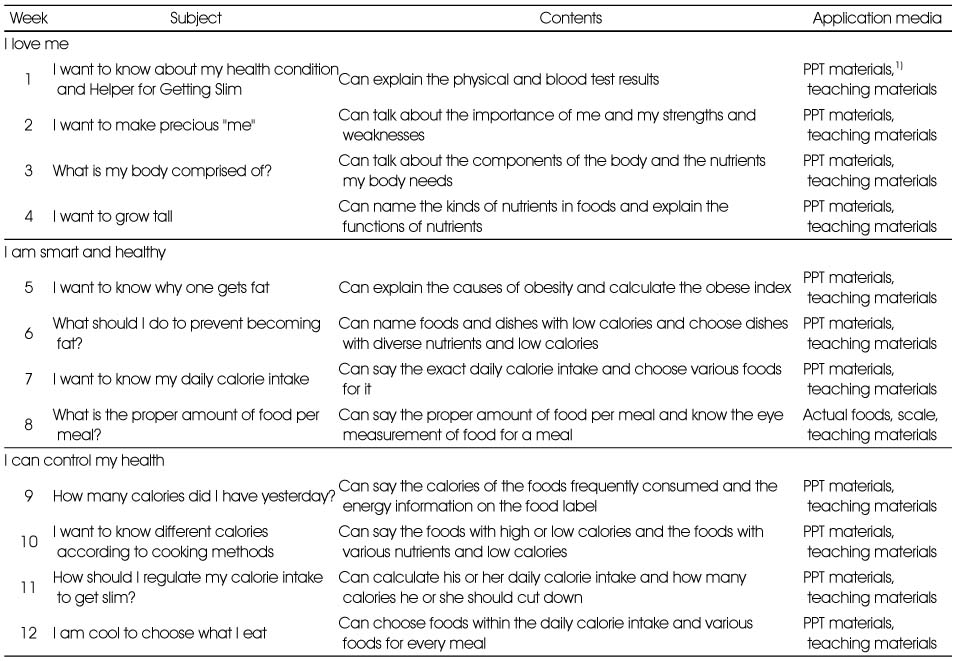
Contents of nutrition education for obese children
1) PPT materials: Powerpoint materials
General characteristics of the subjects
1) N (%), 2) Mean ± SD, 3) ***: p < 0.001 by repeated measured ANOVA, 4) values with different alphabets within the same row are significantly different each other by repeated measured ANOVA adjusted for LSD's multiple comparison test
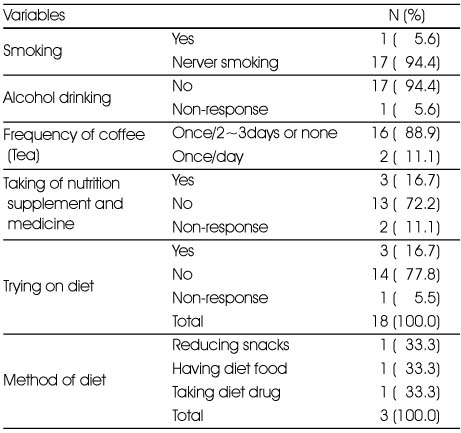
Item's related to health
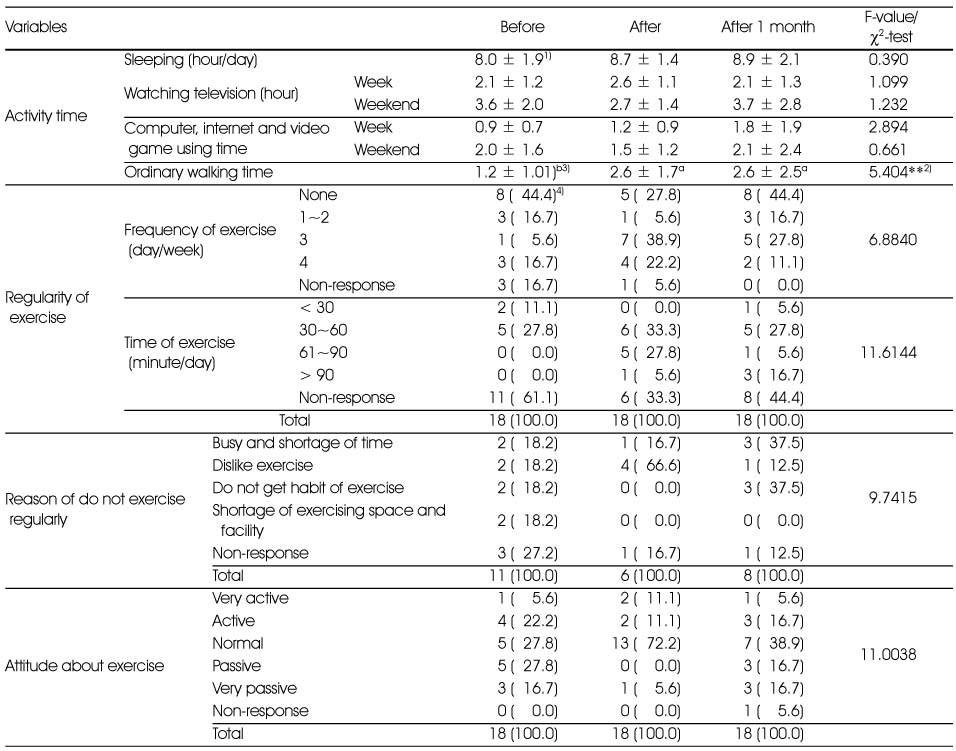
Changes of physical activity
1) Mean ± SD, 2) **: p < 0.01 by repeated measured ANOVA, 3) values with different alphabets within the same row are significantly different each other by repeated measured ANOVA adjusted for LSD's multiple comparison test, 4) N (%)
Changes of food habits
1) Mean ± SD, 2) *: p < 0.05, **: p < 0.01 by repeated measured ANOVA, 3) values with different alphabets within the same row are significantly different each other by repeated measured ANOVA adjusted for LSD's multiple comparison test
Changes of food intake frequency
1) Mean ± SD, 2) **: p < 0.01 by repeated measured ANOVA, 3) values with different alphabets within the same row are significantly different each other by repeated measured ANOVA adjusted for LSD's multiple comparison test
Changes of eating behavior
1) Mean ± SD, 2) *: p < 0.05, **: p < 0.01 by repeated measured ANOVA, 3) values with different alphabets within the same row are significantly different each other by repeated measured ANOVA adjusted for LSD's multiple comparison test
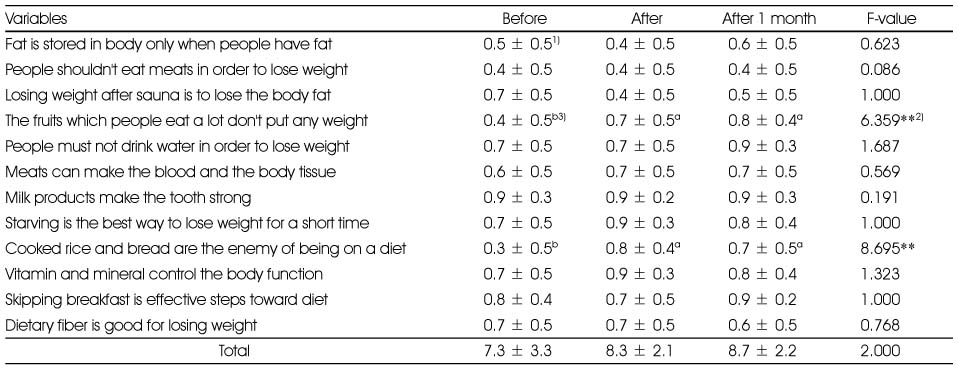
Changes of nutritional knowledges
1) Mean ± SD, 2) **: p < 0.01 by repeated measured ANOVA, 3) values with different alphabets within the same row are significantly different each other by repeated measured ANOVA adjusted for LSD's multiple comparison test
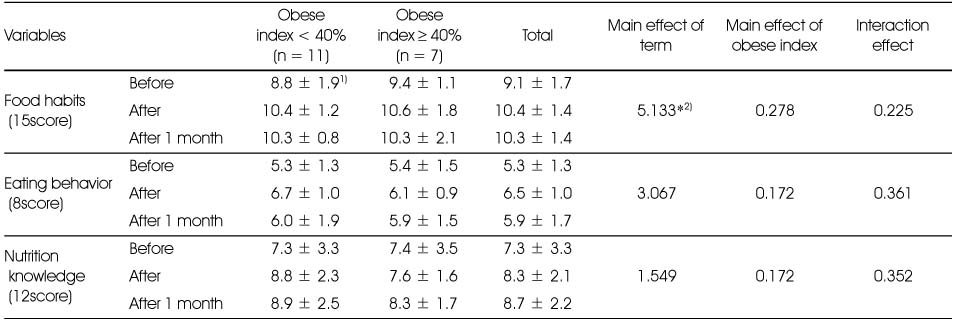
Changes of dietary pattern scores on obese index
1) Mean ± SD, 2) *: p < 0.05 by repeated measured ANOVA
1) PPT materials: Powerpoint materials
1) N (%), 2) Mean ± SD, 3) ***: p < 0.001 by repeated measured ANOVA, 4) values with different alphabets within the same row are significantly different each other by repeated measured ANOVA adjusted for LSD's multiple comparison test
1) Mean ± SD, 2) **: p < 0.01 by repeated measured ANOVA, 3) values with different alphabets within the same row are significantly different each other by repeated measured ANOVA adjusted for LSD's multiple comparison test, 4) N (%)
1) Mean ± SD, 2) *: p < 0.05, **: p < 0.01 by repeated measured ANOVA, 3) values with different alphabets within the same row are significantly different each other by repeated measured ANOVA adjusted for LSD's multiple comparison test
1) Mean ± SD, 2) **: p < 0.01 by repeated measured ANOVA, 3) values with different alphabets within the same row are
significantly different each other by repeated measured ANOVA adjusted for LSD's multiple comparison test
1) Mean ± SD, 2) *: p < 0.05, **: p < 0.01 by repeated measured ANOVA, 3) values with different alphabets within the same row are significantly different each other by repeated measured ANOVA adjusted for LSD's multiple comparison test
1) Mean ± SD, 2) **: p < 0.01 by repeated measured ANOVA, 3) values with different alphabets within the same row are significantly different each other by repeated measured ANOVA adjusted for LSD's multiple comparison test
1) Mean ± SD, 2) *: p < 0.05 by repeated measured ANOVA

 KSCN
KSCN



 PubReader
 Cite
Cite


