Articles
- Page Path
- HOME > Korean J Community Nutr > Volume 16(4); 2011 > Article
-
Original Article
- Dietary and Lifestyle Factors Associated with Hypertension in Korean Adolescents: Based on 2005 Korean National Health and Nutrition Examination Survey
- Killye Kim, Sook Mee Son, Hye-Kyeong Kim
-
Korean Journal of Community Nutrition 2011;16(4):439-453.
DOI: https://doi.org/10.5720/kjcn.2011.16.4.439
Published online: August 31, 2011
Department of Food Science & Nutrition, The Catholic University of Korea, Bucheon, Korea.
- Corresponding author: Hye-Kyeong Kim, Department of Food Science & Nutrition, The Catholic University of Korea, 43-1 Yeokgok 2-dong, Wonmi-gu, Bucheon, Gyeonggi-do 420-743, Korea. Tel: (02) 2164-4314, Fax: (02) 2164-4314, hkyeong@catholic.ac.kr
Copyright © 2011 The Korean Society of Community Nutrition
- 1,172 Views
- 4 Download
- 6 Crossref
Abstract
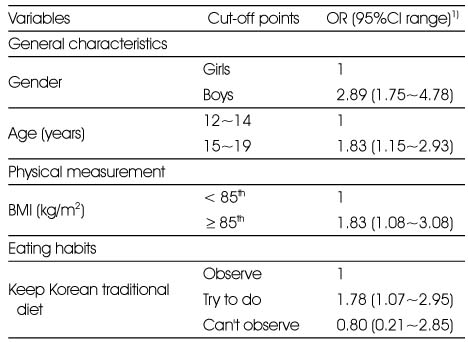
- This study was performed to determine dietary and lifestyle factors associated with hypertension in Korean adolescents. Study subjects were 12~19 years (n = 521) adolescents who participated in the 2005 Korean National Health and Nutrition Examination Survey (KNHANES III). Subjects were divided into the hypertensive group (HG, n = 102) and normotensive group (NG, n = 419) by '2007 Korean children and adolescents growth standard' and the relationships between blood pressure and physical measurement, nutrients intakes, eating behaviors and health related factors were analyzed. HG showed significantly higher levels in weight, waist circumference and BMI than NG. The amount of nutrient intakes was not different between NG and HG. Index of nutritional quality (INQ) for phosphate was higher in HG compared with NG. In both male and female HG, INQ for iron was higher but INQ for vitamin B1 was lower than NG. HG revealed higher consumption frequencies of snack, yoghurt, and ice cream compared with NG. In eating and behavioral factors, 'dinner with family', 'eat proper amount', 'keep Korean traditional diet', alcohol drinking, and mean alcohol intake were significantly different between the two groups. By logistic regression method, risk factors for hypertension revealed in this study were gender (male), age (15~19 years), BMI (≥ 85 percentile), and not keeping Korean traditional diet. These results suggest that education program for hypertension prevention in adolescents should include eating habits improvement and lifestyle modification as well as weight control.
- 1. Alonso A, Beunza JJ, Delgado-Rodriguez M, Martinez JA, Martinez-Gonzalez MA. Low-fat dairy consumption and reduced risk of hypertension : the Seguimiento Universidad de Navarra (SUN) cohort. Am J Clin Nutr. 2005; 82(5): 972-979.ArticlePubMed
- 2. Byeon YS, Lee HS. Relation of the blood pressure, lipids and body mass index by smoking status among adolescents. J Korean Acad Nurs. 2007; 37(6): 1020-1026.ArticlePDF
- 3. Chang SO. The amount of sodium in the processed foods, the use of sodium information on the nutrition label and the acceptance of sodium reduced ramen in the female college students. Korean J Nutr. 2006; 39(6): 585-591.
- 4. Chen X, Wang Y. Tracking of blood pressure from childhood to adulthood : a systematic review and meta-regression analysis. Circulation. 2008; 117(25): 3171-3180.ArticlePubMedPMC
- 5. Chobanian AV, Bakris GL, Black HR, Cushman WC, Green LA, Izzo JL Jr, Jones DW, Materson BJ, Oparil S, Wright JT Jr, Roccella EJ. The Seventh Report of the Joint National Committee on Prevention, Detection, Evaluation, and Treatment of High Blood Pressure: the JNC 7 Report. JAMA. 2003; 289(19): 2560-2572.ArticlePubMed
- 6. Choi MK, Bae YJ. A study on blood lipids and blood pressure of adult men and women according to vegetable intake. Korean J Community Nutr. 2007; 12(6): 761-772.
- 7. Choi MK, Lee WY, Park JD. Relation among mineral (Ca, P, Fe, Na, K, Zn) intakes, blood pressure, and blood lipids in Korean adults. Korean J Nutr. 2005; 38(10): 827-835.
- 8. Choi YG, Song HJ, Kang JH. Prevalence of the metabolic syndrome in Korean children and adolescents according to the international diabetes federation definition in children and adolescents. Korean J Fam Med. 2009; 30(4): 261-268.Article
- 9. Choi YS, Kim YO, Suh L. Association of blood pressure with sodium and potassium intake for adolescents. J Korean Soc Food Nutr. 1995; 24(4): 493-501.
- 10. Chung HC, Chang KJ. Body composition of male college students by standard guideline for Korean dietary. J East Asian Soc Dietary Life. 2006; 16(3): 261-271.
- 11. Clarke WR, Schrott HG, Leaverton PE. Tracking of blood lipids and blood pressure in school age children : The muscatine study. Circulation. 1978; 58(4): 626-634.ArticlePubMed
- 12. Cushman WC. Alcohol consumption and hypertension. J Clin Hypertens (Greenwich). 2001; 3(3): 166-170.ArticlePubMed
- 13. Dahl LK. Possible role of salt intake in the development of essential hypertension. Int J Epidemiol. 2005; 34(5): 967-972.ArticlePubMed
- 14. Deng PY, Li YJ. Calcitonin gene-related peptide and hypertension. Peptides. 2005; 26(9): 1676-1685.ArticlePubMed
- 15. Falkner B, Sadowski RH. Hypertension in children and adolescents. Am J Hypertens. 1995; 8(12 Pt 2): 106s-110s.ArticlePubMed
- 16. Gillman MW, Ellison RC. Childhood prevention of essential hypertension. Pediatr Clin North Am. 1993; 40(1): 179-194.ArticlePubMed
- 17. He J, Ogden LG, Vupputuri S, Bazzano LA, Loria C, Whelton PK. Dietary sodium intake and subsequent risk of cardiovascular disease in overweight adults. JAMA. 1999; 282(21): 2027-2034.ArticlePubMed
- 18. Jee SH, Suh I, Kim IS, Appel LJ. Smoking and atherosclerotic cardiovascular disease in men with low levels of serum cholesterol: The Korea medical insurance corporation study. JAMA. 1999; 282(22): 2149-2155.ArticlePubMed
- 19. Kim DH, Seong TJ, Hong YJ, Son BK, Kim SK. Relationship between body fat distribution and metabolic risk factors in adolescents. J Korean Pediatr Soc. 2003; 46(4): 326-334.
- 20. Kim EK, Yoo MY, Jean KS. Blood pressure, salt threshold, salt preference, urinary excretions and nutrition knowledge about blood pressure of elementary school children in rural area. Korean J Nutr. 1993; 26(5): 625-638.
- 21. Kim HG, Lim GW, Kim HS, Hong YM. Effects of a 12-week, school-based obesity management program on obese primary school children. Korean J Pediatr. 2010; 53(3): 335-340.Article
- 22. Kim HS, Lee BH. Influence of computer use hours on physical development, dietary patterns, and nutritional status of higher grade elementary school children. Korean J Nutr. 2008; 41(2): 165-173.
- 23. Kim JY, Han YS, Bae HS, Ahn HS. Dietary intakes and serum lipids and iron indices in obese children. Korean J Community Nutr. 2006a; 11(5): 575-586.
- 24. Kim YJ, Kim SG, Paek YM, Kim MK. Comparison of energy nutrient and fat intake between the hypertensive and normotensive male workers. Korean J Occup Environ Med. 2006b; 18(4): 263-271.ArticlePDF
- 25. Kim YS. Lifestyle and chronic disease-A cohort study on the risk factors for hypertension and NIDDM in Korea. Korean J Community Nutr. 2003; 8(6): 1010-1020.
- 26. Korea National Statistical Office. Annual report on the cause of death statistics. 2009; Seoul.
- 27. Lee JW, Hwang YS, Hong YS, Im HS. Effects of dietary calcium levels on blood pressure and calcium metabolism in normotensive female young adults with the hypertension family history. Korean J Nutr. 1993; 26(6): 728-742.
- 28. Lee JW, La HS, Kwak CS. Dietary factors and serum and urinary electrolytes affecting blood pressure in adolescents. Korean J Community Nutr. 1996; 1(1): 61-70.
- 29. Lee JY. A study of salt consumption and related factors among adult females. Korean J Food Nutr. 2001; 14(5): 430-440.
- 30. Lee SH, Sung EJ, Shin HC, Park YW, Kim CH, Soh KS. Factors related to increase of blood pressure in obese children and adolescents. J Korean Acad Fam Med. 2007a; 28(7): 515-522.
- 31. Lee SM, Song HY, Sohn UD. Effect of alcohol consumption characteristics on the body mass index and blood pressure. Yakhak Hoeji. 2007b; 51(6): 389-401.
- 32. Lynch SR. Iron overload-prevalence and impact on heart. Nutr Rev. 1995; 53(9): 255-260.PubMed
- 33. Ministry of Health and Welfare. The third National Health And Nutrition Examination Survey (KNHANES III). 2006.
- 34. Moon HK, Park JH. Comparative analysis and evaluation of dietary Intake between with and without hypertension using 2001 Korea National Health and Nutrition Examination Survey. Korean J Nutr. 2007; 40(4): 347-361.
- 35. Suter PM, Sierro C, Vetter W. Nutritional factors in the control of blood pressure and hypertension. Nutr Clin Care. 2002; 5(1): 9-19.ArticlePubMed
- 36. Park SH, Kang YH, Park HY. Alcohol consumption and the coronary heart disease-related risk factors in Korean adults-the third Korea national health and nutrition examination survey (KNHANES III). Korean J Nutr. 2008; 41(3): 232-241.
- 37. Park YS, Lee DH, Choi JM, Kang YJ, Kim CH. Trend of obesity in school age children in Seoul over the past 23 years. Korean J Pediatr. 2004; 47(3): 247-257.
- 38. Rimm EB, Williams P, Fosher K, Criqui M, Stampfer MJ. Moderate alcohol intake and lower risk of coronary heart disease: meta-analysis of effects on lipids and haemostatic factors. BMJ. 1999; 319(7224): 1523-1528.ArticlePubMedPMC
- 39. Seo MJ, Jeong WS, Sohn KJ, Ko BJ, Han JH, Kim SM. Prevalence of the metabolic syndrome in Korean children and adolescents: Korea national health and nutrition survey 2001. J Korean Acad Fam Med. 2006; 27(10): 798-806.
- 40. Son SM. Rice based meal for prevention of obesity and chronic disease. Korean J Community Nutr. 2001; 6(5): 862-867.
- 41. Son SM, Heo KY. Salt intake and nutritional problems in Korea. Korean J Community Nutr. 2002; 7(3): 381-390.
- 42. Son SM, Huh GY. Dietary risk factors associated with hypertension in patients. Korean J Community Nutr. 2006; 11(5): 661-672.
- 43. Sorof J, Daniels S. Obesity hypertension in children - A problem of epidemic proportions. Hypertension. 2002; 40(4): 441-447.ArticlePubMed
- 44. Suh I, Nam CM, Lee KH, Jee SH, Kim SI, Kim GS, Kim CB. The effect of sodium and potassium intake on blood pressure change in Korean adolescents. Korean J Prev Med. 1998; 31(3): 384-394.
- 45. Sung EJ, Shin TS. The effect of overweight to cardiovascular risk factors among Korean adolescents. J Korean Acad Fam Med. 2003; 24(11): 1017-1025.
- 46. Sugiyama T, Xie D, Graham-Maar RC, Inoue K, Kobayashi Y, Stettler N. Dietary and lifestyle factors associated with blood pressure among U.S. adolescent. J Adolesc Health. 2007; 40(2): 166-172.PubMed
- 47. The Korea Nutrition Society. Dietary reference intakes for Koreans (DRIs for Koreans). 2005.
- 48. The Korean Pediatric Society. Korea Centers for Disease Control and Prevention. The Committee for the Development of Growth Standard for Korean Children and Adolescents. Korean children and adolescents growth standard(commentary of the development of 2007 growth charts). 2007; Seoul.
- 49. Whelton PK. Epidemiology of hypertension. Lancet. 1994; 344(8915): 101-106.PubMed
- 50. Yi KH. Prevalence of obesity, hypertension, and hyperlipidemia in Gunpo children of low economic status. Korean J Pediatr. 2008; 51(12): 1310-1314.
- 51. Yoo JY, Kim YN. Survey of cookie consumption and nutrition labelling of cookie consumed in high school students. Korean J Community Nutr. 2009; 14(2): 147-157.
REFERENCES
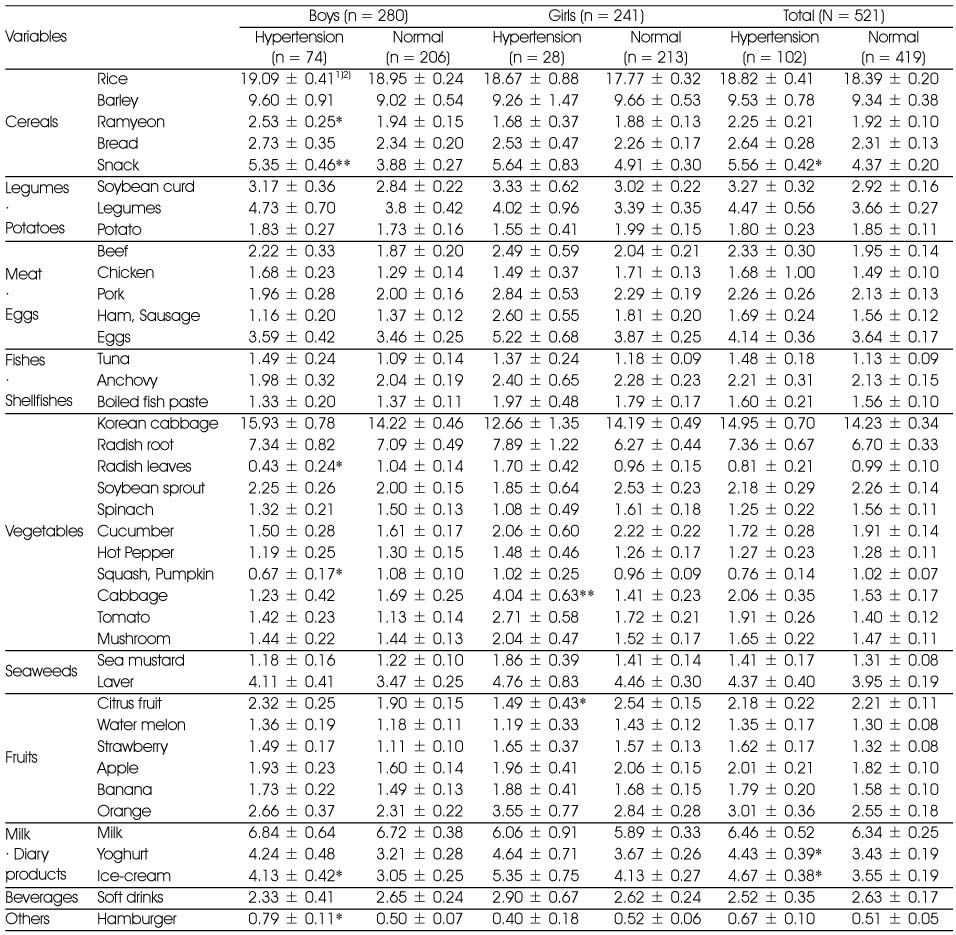
1) Mean ± S.D: by ANCOVA (adjusted by sex, age), *: p < 0.05, **: p < 0.01, ***: p < 0.001
2) Food consumption frequency: Seldom = 0, 6~11 times/year = 0.18, 1 time/month = 0.25, 2~3 times/month = 0.6, 1 time/week = 1 (Standard score), 2~3 times/week = 2.5, 4~6 times/week = 5, 1 time/day = 7, 2 times/day = 14, 3 times/day = 21
Figure & Data
REFERENCES
Citations

- Biochemical Characteristics and Dietary Intake according to Household Income Levels of Korean Adolescents: Using Data from the 6th (2013 ~ 2015) Korea National Health and Nutrition Examination Survey
Yu-Kyeong Kwon, Sook-Bae Kim
Korean Journal of Community Nutrition.2021; 26(6): 467. CrossRef - Differences in SBP, BMI, and Stress with AUDIT Score in Adolescents
Mi-Kyoung Cho, Mi Young Kim
The Open Nursing Journal.2018; 12(1): 228. CrossRef - An analysis of long-term occurrence of renal complications following pediatric pyeloplasty
Hahn-Ey Lee, Kwanjin Park, Hwang Choi
Journal of Pediatric Urology.2014; 10(6): 1083. CrossRef - The Factors related to Dyslipidemia and Hypertension among Male Office Workers
Eun Kyung Lee, Ok Soo Kim
Korean Journal of Adult Nursing.2013; 25(4): 432. CrossRef - A Study on Classification of Obesity for Koreans based on the Articles in the Korean Journal of Community Nutrition - Articles Enlisted from 1996 to 2011 -
Youngnam Kim
Korean Journal of Community Nutrition.2013; 18(5): 525. CrossRef - Association of Bone Mineral Density and Blood Pressure, Calcium Intake among Adult Women in Seoul · Kyunggi Area - Based on 2011 KNHANES -
Jae Ok Koo
Korean Journal of Community Nutrition.2013; 18(3): 269. CrossRef
- We recommend
- Related articles
-
- Ultra-processed food intake and dietary behaviors in Korean adolescents: a cross-sectional study based on the 2019–2023 Korea National Health and Nutrition Examination Survey
- Self-reported weight change and diet quality in relation to metabolic syndrome among Korean cancer survivors: a cross-sectional study using the Korea National Health and Nutrition Examination Survey 2019–2021
- The dietary factors associated with sleep duration in postmenopausal middle-aged women: a cross-sectional study using 2019–2023 Korea National Health and Nutrition Examination Survey data
- Trends in growth and nutritional status of Korean toddlers and preschoolers: a cross-sectional study using 2010–2021 Korea National Health and Nutrition Examination Survey data
- Total sugar intake and its contributed foods by age groups in Koreans using the 8th (2019–2021) Korea National Health and Nutrition Examination Survey: a cross-sectional study
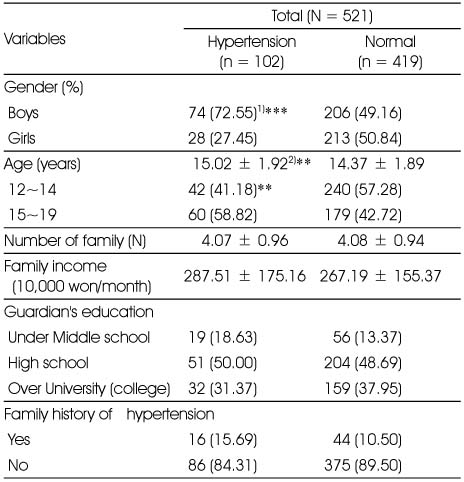
General characteristics of the subjects
1) N (%): by χ2-test. 2) Mean ± SD: by t-test, *: p < 0.05, **: p < 0.01, ***: p < 0.001
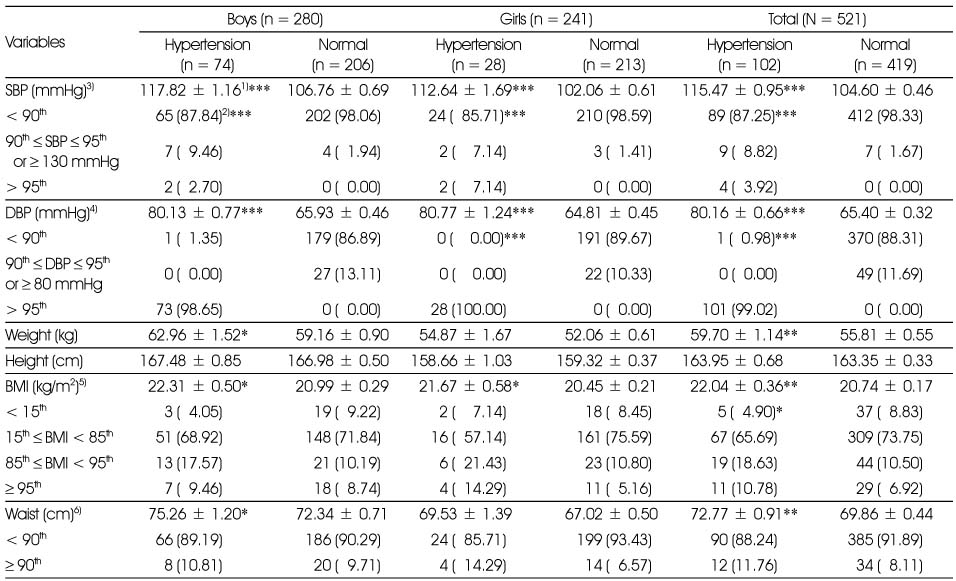
Blood pressure and anthropometric data of the subjects
1) Mean ± SD: by ANCOVA (adjusted by sex, age)
2) N (%): by χ2-test, *: p<0.05, **: p<0.01, ***: p<0.001
3) SBP: Systolic Blood Pressure, 4) DBP: Diastolic Blood Pressure, 5) BMI: Body Mass Index, 6) Waist: Waist Circumference
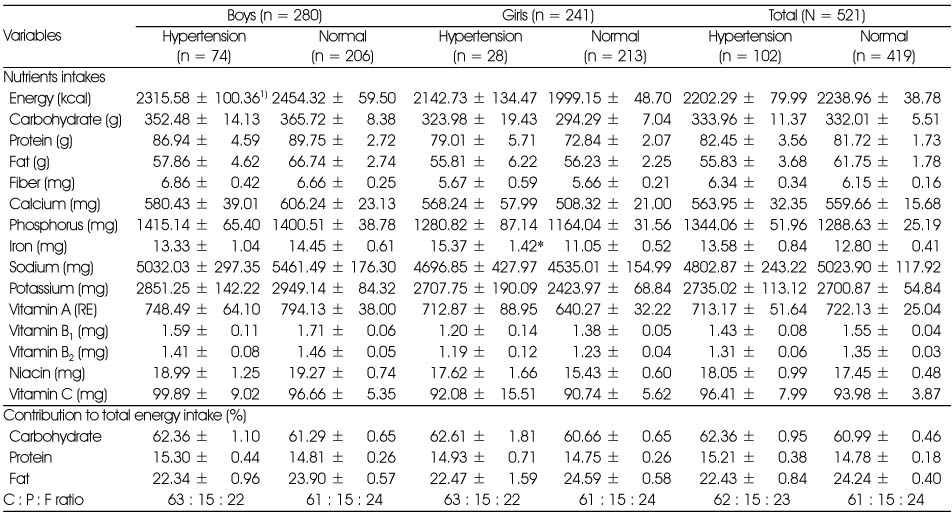
Nutrients intakes for hypertensive and normotensive in Korean adolescents
1) Mean ± SD: by ANCOVA (adjusted by sex, age), *: p < 0.05, **: p < 0.01, ***: p < 0.001
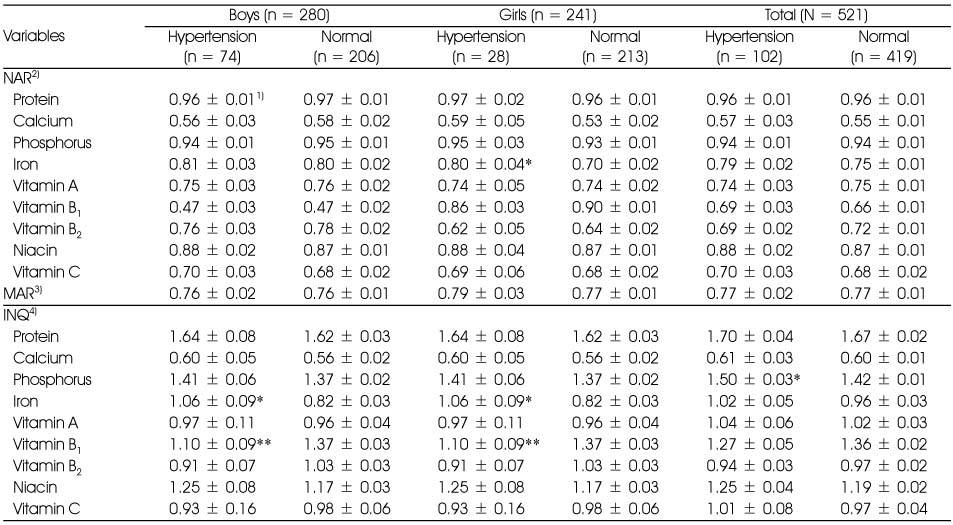
NAR MAR, and INQ for hypertensive and normotensive in Korean adolescents
1) Mean ± SD: by ANCOVA (adjusted by sex, age), *: p < 0.05, **: p < 0.01, ***: p < 0.001
2) NAR: Nutrient Adequacy Ratio, 3) MAR : Mean Adequacy Ratio, 4) INQ : Index of Nutritional Quality
Food consumption frequency for hypertensive and normotensive in Korean adolescents
1) Mean ± S.D: by ANCOVA (adjusted by sex, age), *: p < 0.05, **: p < 0.01, ***: p < 0.001
2) Food consumption frequency: Seldom = 0, 6~11 times/year = 0.18, 1 time/month = 0.25, 2~3 times/month = 0.6, 1 time/week = 1 (Standard score), 2~3 times/week = 2.5, 4~6 times/week = 5, 1 time/day = 7, 2 times/day = 14, 3 times/day = 21
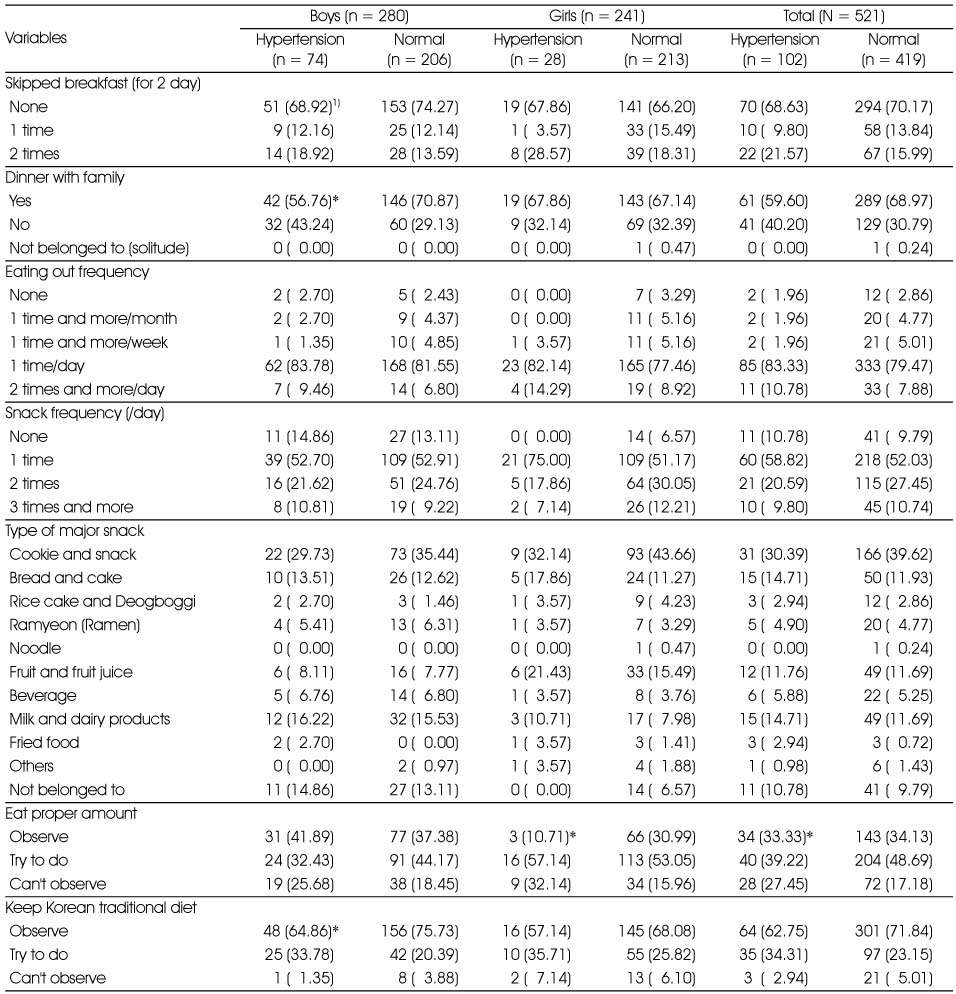
Eating behaviors for hypertensive and normotensive in Korean adolescents
1) N (%): by χ2-test, *: p < 0.05, **: p < 0.01, ***: p < 0.001
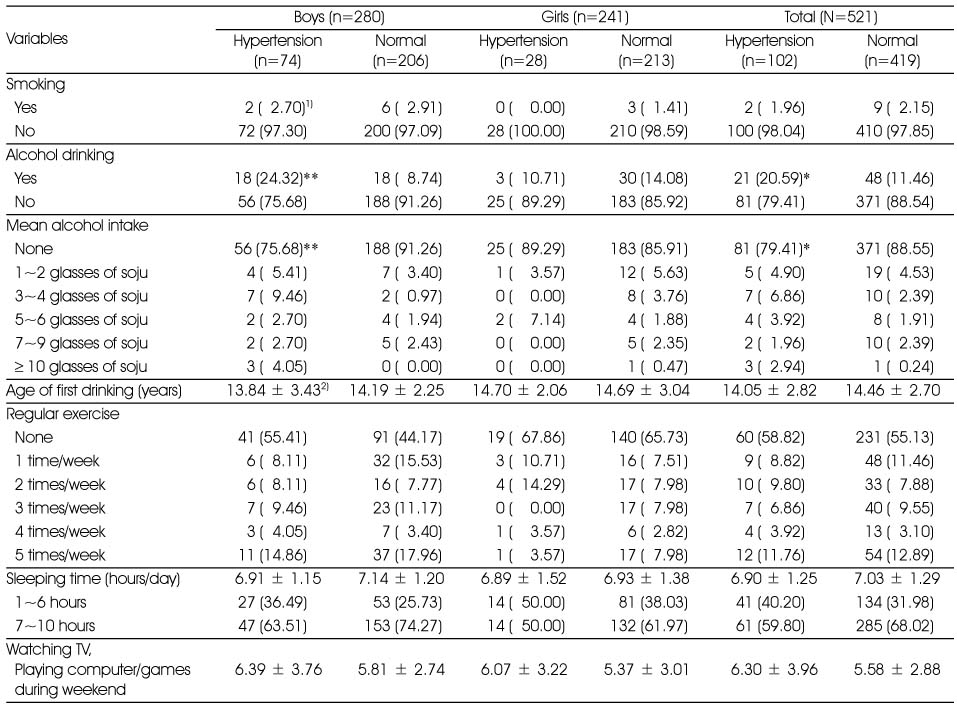
Health-related behaviors for hypertensive and normotensive in Korean adolescents
1) N (%): by χ2-test. 2) Mean ± SD: by t-test, *: p < 0.05, **: p < 0.01, ***: p < 0.001
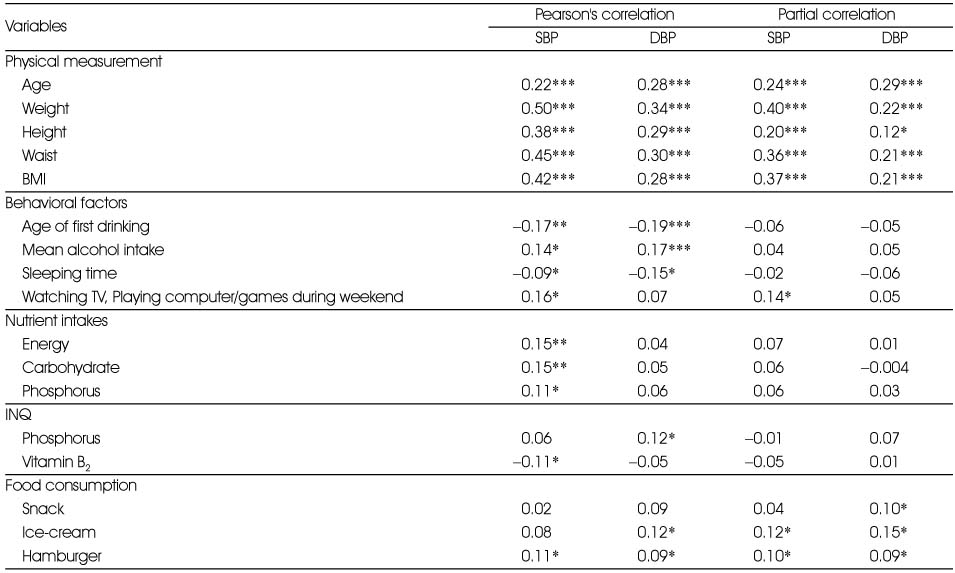
Correlation coefficients between blood pressure and each variables
Significantly different at *: p < 0.05, **: p < 0.01, ***: p < 0.001 by Pearson's correlation and partial correlation (adjusted by sex, age)
Odds ratios of hypertension for variables correlated to blood pressure
1) Multiple logistic regression models include age, sex, bmi, Watching TV · Playing computer/games during weekend, Food consumption of snack · ice-cream · hamburger
1) N (%): by χ2-test. 2) Mean ± SD: by t-test, *: p < 0.05, **: p < 0.01, ***: p < 0.001
1) Mean ± SD: by ANCOVA (adjusted by sex, age) 2) N (%): by χ2-test, *: p<0.05, **: p<0.01, ***: p<0.001 3) SBP: Systolic Blood Pressure, 4) DBP: Diastolic Blood Pressure, 5) BMI: Body Mass Index, 6) Waist: Waist Circumference
1) Mean ± SD: by ANCOVA (adjusted by sex, age), *: p < 0.05, **: p < 0.01, ***: p < 0.001
1) Mean ± SD: by ANCOVA (adjusted by sex, age), *: p < 0.05, **: p < 0.01, ***: p < 0.001 2) NAR: Nutrient Adequacy Ratio, 3) MAR : Mean Adequacy Ratio, 4) INQ : Index of Nutritional Quality
1) Mean ± S.D: by ANCOVA (adjusted by sex, age), *: p < 0.05, **: p < 0.01, ***: p < 0.001 2) Food consumption frequency: Seldom = 0, 6~11 times/year = 0.18, 1 time/month = 0.25, 2~3 times/month = 0.6, 1 time/week = 1 (Standard score), 2~3 times/week = 2.5, 4~6 times/week = 5, 1 time/day = 7, 2 times/day = 14, 3 times/day = 21
1) N (%): by χ2-test, *: p < 0.05, **: p < 0.01, ***: p < 0.001
1) N (%): by χ2-test. 2) Mean ± SD: by t-test, *: p < 0.05, **: p < 0.01, ***: p < 0.001
Significantly different at *: p < 0.05, **: p < 0.01, ***: p < 0.001 by Pearson's correlation and partial correlation (adjusted by sex, age)
1) Multiple logistic regression models include age, sex, bmi, Watching TV · Playing computer/games during weekend, Food consumption of snack · ice-cream · hamburger

 KSCN
KSCN
 Cite
Cite


