
Articles
- Page Path
- HOME > Korean J Community Nutr > Volume 16(4); 2011 > Article
-
Original Article
- Dietary and Lifestyle Factors Associated with Hypertension in Korean Adolescents: Based on 2005 Korean National Health and Nutrition Examination Survey
- Killye Kim, Sook Mee Son, Hye-Kyeong Kim
-
Korean Journal of Community Nutrition 2011;16(4):439-453.
DOI: https://doi.org/10.5720/kjcn.2011.16.4.439
Published online: August 31, 2011
Department of Food Science & Nutrition, The Catholic University of Korea, Bucheon, Korea.
- Corresponding author: Hye-Kyeong Kim, Department of Food Science & Nutrition, The Catholic University of Korea, 43-1 Yeokgok 2-dong, Wonmi-gu, Bucheon, Gyeonggi-do 420-743, Korea. Tel: (02) 2164-4314, Fax: (02) 2164-4314, hkyeong@catholic.ac.kr
• Received: July 25, 2011 • Revised: July 22, 2011 • Accepted: August 16, 2011
Copyright © 2011 The Korean Society of Community Nutrition
- 1,505 Views
- 5 Download
- 6 Crossref
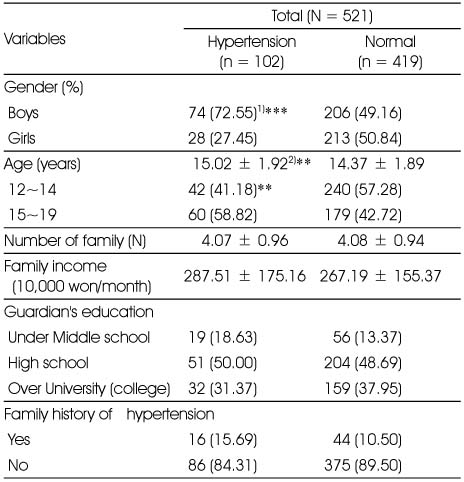
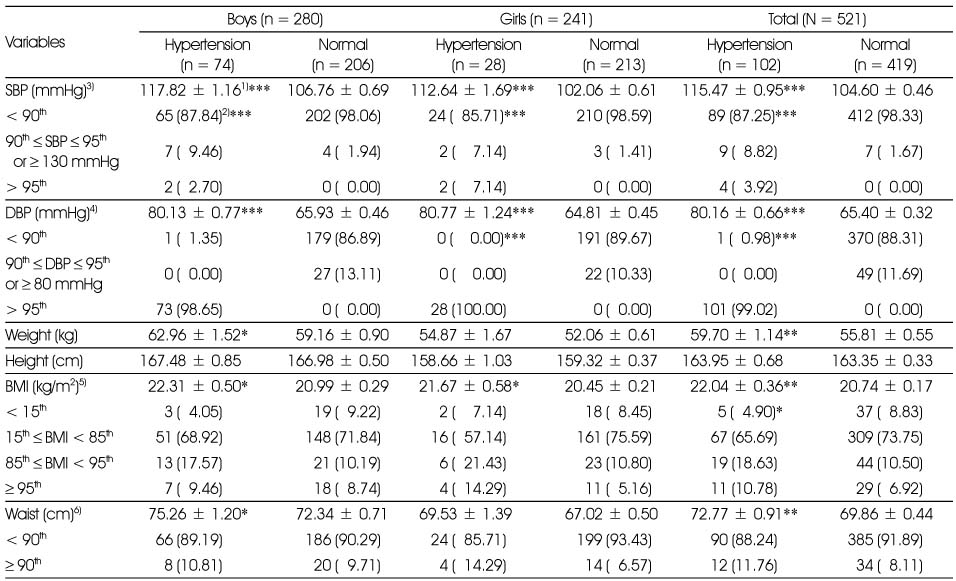
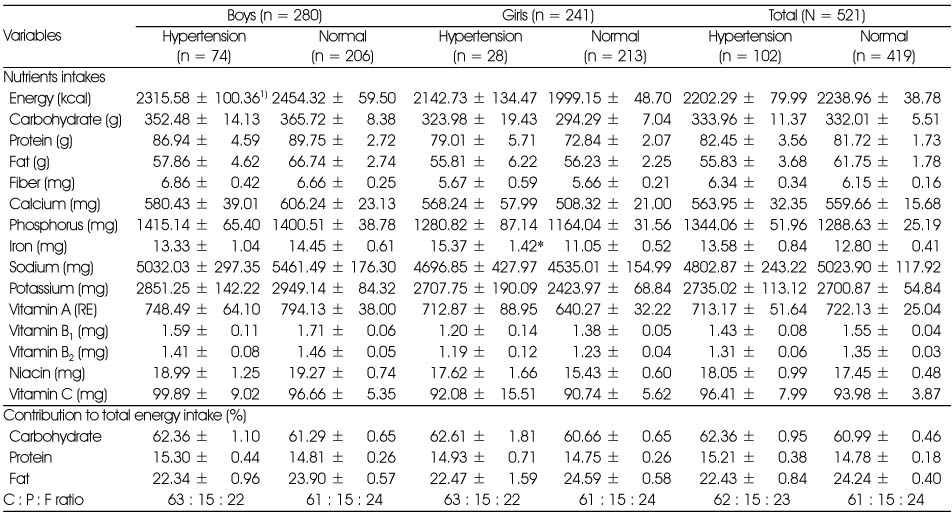
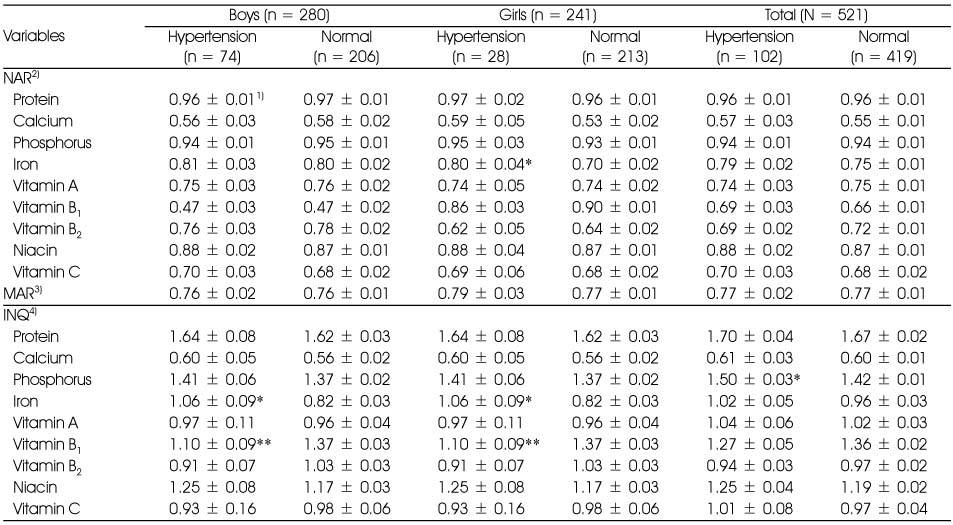
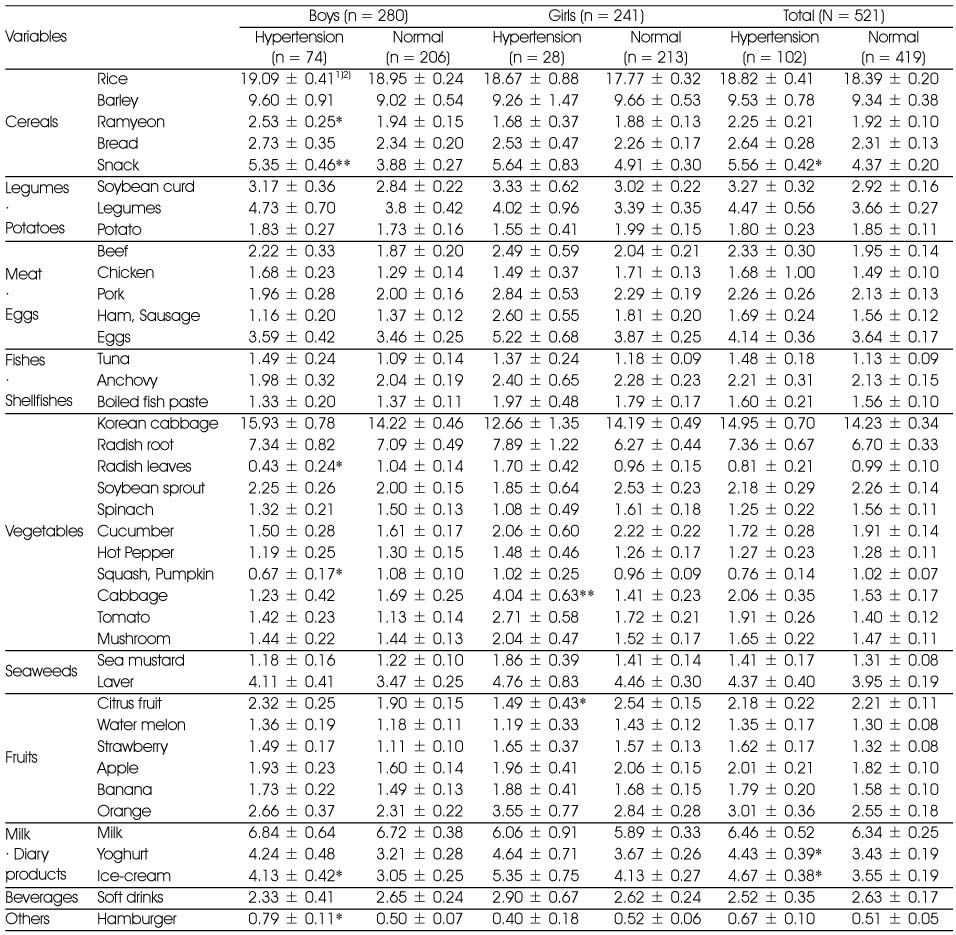
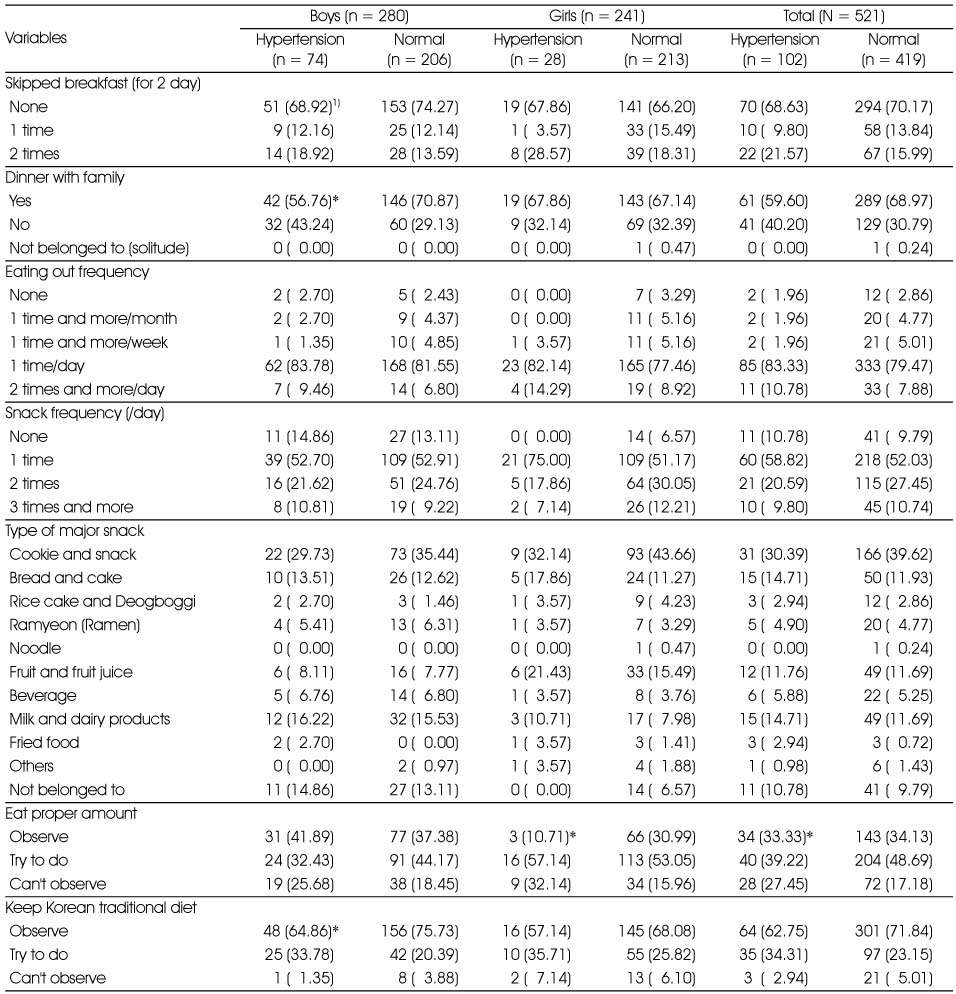
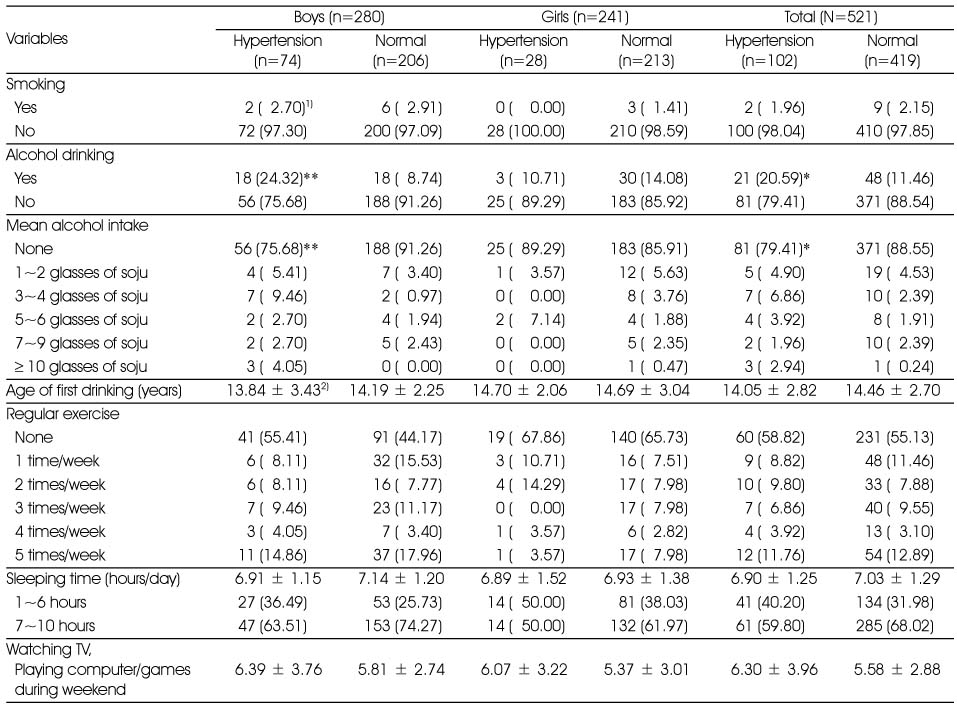
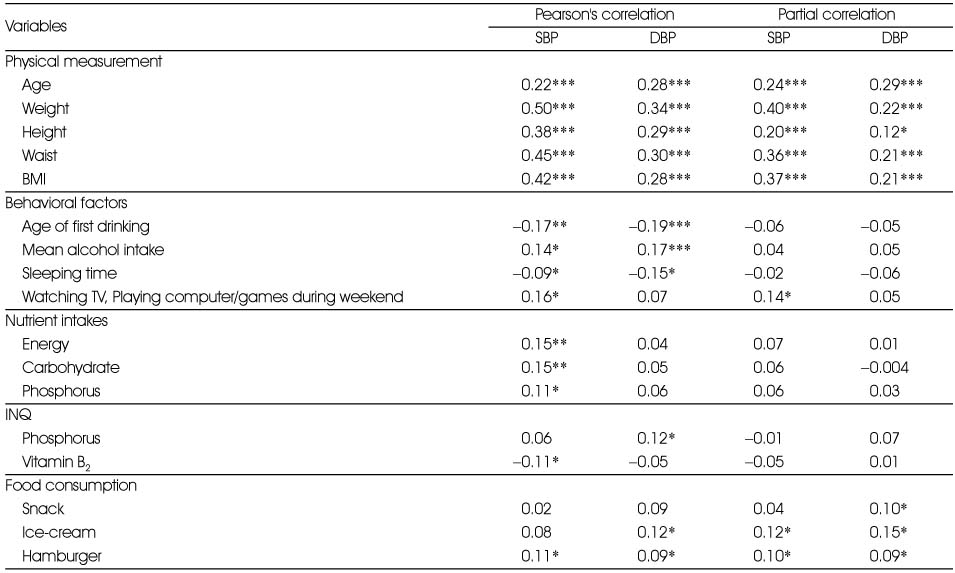
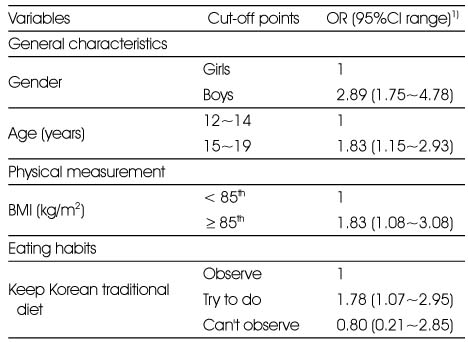
Figure & Data
REFERENCES
Citations
Citations to this article as recorded by 
- Biochemical Characteristics and Dietary Intake according to Household Income Levels of Korean Adolescents: Using Data from the 6th (2013 ~ 2015) Korea National Health and Nutrition Examination Survey
Yu-Kyeong Kwon, Sook-Bae Kim
Korean Journal of Community Nutrition.2021; 26(6): 467. CrossRef - Differences in SBP, BMI, and Stress with AUDIT Score in Adolescents
Mi-Kyoung Cho, Mi Young Kim
The Open Nursing Journal.2018; 12(1): 228. CrossRef - An analysis of long-term occurrence of renal complications following pediatric pyeloplasty
Hahn-Ey Lee, Kwanjin Park, Hwang Choi
Journal of Pediatric Urology.2014; 10(6): 1083. CrossRef - The Factors related to Dyslipidemia and Hypertension among Male Office Workers
Eun Kyung Lee, Ok Soo Kim
Korean Journal of Adult Nursing.2013; 25(4): 432. CrossRef - A Study on Classification of Obesity for Koreans based on the Articles in the Korean Journal of Community Nutrition - Articles Enlisted from 1996 to 2011 -
Youngnam Kim
Korean Journal of Community Nutrition.2013; 18(5): 525. CrossRef - Association of Bone Mineral Density and Blood Pressure, Calcium Intake among Adult Women in Seoul · Kyunggi Area - Based on 2011 KNHANES -
Jae Ok Koo
Korean Journal of Community Nutrition.2013; 18(3): 269. CrossRef
 Cite
Cite- We recommend
- Related articles
-
- Comparison of dietary behaviors and nutrient intake by gender and household type among older Koreans: a cross-sectional study using data from the 8th Korea National Health and Nutrition Examination Survey
- Ultra-processed food intake and dietary behaviors in Korean adolescents: a cross-sectional study based on the 2019–2023 Korea National Health and Nutrition Examination Survey
- Self-reported weight change and diet quality in relation to metabolic syndrome among Korean cancer survivors: a cross-sectional study using the Korea National Health and Nutrition Examination Survey 2019–2021
- The dietary factors associated with sleep duration in postmenopausal middle-aged women: a cross-sectional study using 2019–2023 Korea National Health and Nutrition Examination Survey data
- Trends in growth and nutritional status of Korean toddlers and preschoolers: a cross-sectional study using 2010–2021 Korea National Health and Nutrition Examination Survey data
Dietary and Lifestyle Factors Associated with Hypertension in Korean Adolescents: Based on 2005 Korean National Health and Nutrition Examination Survey
Dietary and Lifestyle Factors Associated with Hypertension in Korean Adolescents: Based on 2005 Korean National Health and Nutrition Examination Survey
General characteristics of the subjects
1) N (%): by χ2-test. 2) Mean ± SD: by t-test, *: p < 0.05, **: p < 0.01, ***: p < 0.001
Blood pressure and anthropometric data of the subjects
1) Mean ± SD: by ANCOVA (adjusted by sex, age)
2) N (%): by χ2-test, *: p<0.05, **: p<0.01, ***: p<0.001
3) SBP: Systolic Blood Pressure, 4) DBP: Diastolic Blood Pressure, 5) BMI: Body Mass Index, 6) Waist: Waist Circumference
Nutrients intakes for hypertensive and normotensive in Korean adolescents
1) Mean ± SD: by ANCOVA (adjusted by sex, age), *: p < 0.05, **: p < 0.01, ***: p < 0.001
NAR MAR, and INQ for hypertensive and normotensive in Korean adolescents
1) Mean ± SD: by ANCOVA (adjusted by sex, age), *: p < 0.05, **: p < 0.01, ***: p < 0.001
2) NAR: Nutrient Adequacy Ratio, 3) MAR : Mean Adequacy Ratio, 4) INQ : Index of Nutritional Quality
Food consumption frequency for hypertensive and normotensive in Korean adolescents
1) Mean ± S.D: by ANCOVA (adjusted by sex, age), *: p < 0.05, **: p < 0.01, ***: p < 0.001
2) Food consumption frequency: Seldom = 0, 6~11 times/year = 0.18, 1 time/month = 0.25, 2~3 times/month = 0.6, 1 time/week = 1 (Standard score), 2~3 times/week = 2.5, 4~6 times/week = 5, 1 time/day = 7, 2 times/day = 14, 3 times/day = 21
Eating behaviors for hypertensive and normotensive in Korean adolescents
1) N (%): by χ2-test, *: p < 0.05, **: p < 0.01, ***: p < 0.001
Health-related behaviors for hypertensive and normotensive in Korean adolescents
1) N (%): by χ2-test. 2) Mean ± SD: by t-test, *: p < 0.05, **: p < 0.01, ***: p < 0.001
Correlation coefficients between blood pressure and each variables
Significantly different at *: p < 0.05, **: p < 0.01, ***: p < 0.001 by Pearson's correlation and partial correlation (adjusted by sex, age)
Odds ratios of hypertension for variables correlated to blood pressure
1) Multiple logistic regression models include age, sex, bmi, Watching TV · Playing computer/games during weekend, Food consumption of snack · ice-cream · hamburger
Table 1
General characteristics of the subjects
1) N (%): by χ2-test. 2) Mean ± SD: by t-test, *: p < 0.05, **: p < 0.01, ***: p < 0.001
Table 2
Blood pressure and anthropometric data of the subjects
1) Mean ± SD: by ANCOVA (adjusted by sex, age) 2) N (%): by χ2-test, *: p<0.05, **: p<0.01, ***: p<0.001 3) SBP: Systolic Blood Pressure, 4) DBP: Diastolic Blood Pressure, 5) BMI: Body Mass Index, 6) Waist: Waist Circumference
Table 3
Nutrients intakes for hypertensive and normotensive in Korean adolescents
1) Mean ± SD: by ANCOVA (adjusted by sex, age), *: p < 0.05, **: p < 0.01, ***: p < 0.001
Table 4
NAR MAR, and INQ for hypertensive and normotensive in Korean adolescents
1) Mean ± SD: by ANCOVA (adjusted by sex, age), *: p < 0.05, **: p < 0.01, ***: p < 0.001 2) NAR: Nutrient Adequacy Ratio, 3) MAR : Mean Adequacy Ratio, 4) INQ : Index of Nutritional Quality
Table 5
Food consumption frequency for hypertensive and normotensive in Korean adolescents
1) Mean ± S.D: by ANCOVA (adjusted by sex, age), *: p < 0.05, **: p < 0.01, ***: p < 0.001 2) Food consumption frequency: Seldom = 0, 6~11 times/year = 0.18, 1 time/month = 0.25, 2~3 times/month = 0.6, 1 time/week = 1 (Standard score), 2~3 times/week = 2.5, 4~6 times/week = 5, 1 time/day = 7, 2 times/day = 14, 3 times/day = 21
Table 6
Eating behaviors for hypertensive and normotensive in Korean adolescents
1) N (%): by χ2-test, *: p < 0.05, **: p < 0.01, ***: p < 0.001
Table 7
Health-related behaviors for hypertensive and normotensive in Korean adolescents
1) N (%): by χ2-test. 2) Mean ± SD: by t-test, *: p < 0.05, **: p < 0.01, ***: p < 0.001
Table 8
Correlation coefficients between blood pressure and each variables
Significantly different at *: p < 0.05, **: p < 0.01, ***: p < 0.001 by Pearson's correlation and partial correlation (adjusted by sex, age)
Table 9
Odds ratios of hypertension for variables correlated to blood pressure
1) Multiple logistic regression models include age, sex, bmi, Watching TV · Playing computer/games during weekend, Food consumption of snack · ice-cream · hamburger


