
Articles
- Page Path
- HOME > Korean J Community Nutr > Volume 28(2); 2023 > Article
-
Research Article
대구지역 초등학생의 식습관, 단맛 미각 판정 및 당류 급원 식품 섭취 간 상관성 연구 -
김민정1)
 , 신은경2), 이연경3),†
 - Association between eating habits, sweet taste assessment, and high-sugar food consumption among elementary school students in Daegu: a descriptive study
-
Min-Jung Kim1), Eun-Kyung Shin2), Yeon-Kyung Lee3),†
-
Korean Journal of Community Nutrition 2023;28(2):104-113.
DOI: https://doi.org/10.5720/kjcn.2023.28.2.104
Published online: April 30, 2023
1)경북대학교 교육대학원 영양교육전공, 학생
2)경북대학교 식품영양학과, 강사
3)경북대학교 식품영양학과, 교수
1)Student, Major in Nutrition Education, Kyungpook National University, Daegu, Korea
2)Lecture, Department of Food Science and Nutrition, Kyungpook National University, Daegu, Korea
3)Professor, Department of Food Science and Nutrition, Kyungpook National University, Daegu, Korea
- †Corresponding author Yeon-Kyung Lee Department of Food Science and Nutrition, Kyungpook National University, 80, Daehak-ro, Bukgu, Daegu 41566, Korea Tel: +82-53-950-6234 Fax: +82-53-950-6229 E-mail: yklee@knu.ac.kr
• Received: February 23, 2022 • Revised: April 22, 2023 • Accepted: April 24, 2023
© 2023 The Korean Society of Community Nutrition
This is an Open-Access article distributed under the terms of the Creative Commons Attribution Non-Commercial License (http://creativecommons.org/licenses/by-nc/4.0) which permits unrestricted non-commercial use, distribution, and reproduction in any medium, provided the original work is properly cited.
- 1,417 Views
- 41 Download
Abstract
-
Objectives
- The purpose of this study was to analyze high-sugar food consumption habits frequency among elementary school students, and their correlations with eating habits and sweet taste assessment.
-
Methods
- The participants of the study were 164 elementary school students in Daegu, in the fifth or sixth grade, along with their parents. A questionnaire investigated eating habits, high-sugar food consumption habits and frequency, and sweet taste assessment.
-
Results
- The average eating habits score for elementary school students was determined to be 71.7 out of 100. Students with higher eating habits scores had lower high-sugar food consumption habits and frequency compared to those with lower eating habits scores. Sweet taste assessment revealed that students who preferred less sweetness chose a 5% sugar concentration, those with a preference for normal sweetness chose a 10% sugar concentration, and those who preferred sweeter tastes chose a 20% sugar concentration. Sweet taste assessment showed that students who tended to prefer less sweetness had the highest eating habits scores and the lowest scores for high-sugar food consumption habits and frequency. In addition, eating habits scores were found to be negatively correlated with high-sugar food consumption habits, high-sugar food consumption frequency, and sweet taste assessment. The sweet taste assessment was positively correlated with high-sugar food consumption habits and frequency.
-
Conclusions
- Our results indicate that students with good eating habits had more desirable overall sugar intake habits, and when the preference for sweetness was high, the frequency of high-sugar food consumption was also high. Our study highlights the importance of educating elementary school students and their parents about the harmful effects of excessive sugar consumption, as well as the benefits of adopting healthy eating habits and creating supportive environments.
Introduction
Methods
Results
Discussion
Conclusion
-
Conflict of Interest
There are no financial or other issues that might lead to conflict of interest.
-
Funding
This research received no external funding.
-
Data Availability
The participants of this study did not give written consent for their data to be shared publicly so due to the sensitive nature of the research supporting data is not available.
NOTES
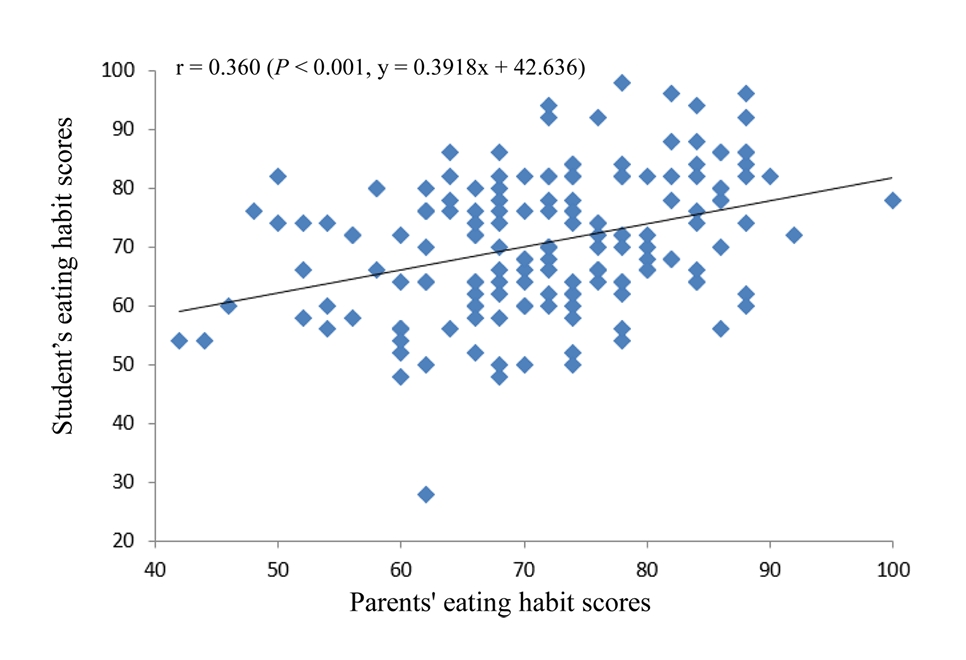
Table 1.Eating habits of elementary school students
| Items | Total (n = 164) | Boys (n = 76) | Girls (n = 88) | P-value |
|---|---|---|---|---|
| Eat regularly scheduled meals | 3.46 ± 1.05 | 3.63 ± 1.05 | 3.32 ± 1.06 | 0.057 |
| Eat evenly without being picky | 3.59 ± 1.07 | 3.66 ± 1.04 | 3.52 ± 1.09 | 0.135 |
| Eat in moderation without overeating | 3.70 ± 0.90 | 3.64 ± 0.95 | 3.74 ± 0.86 | 0.508 |
| Eat always food less salty | 2.55 ± 0.99 | 2.47 ± 0.97 | 2.63 ± 1.01 | 0.332 |
| Eat while watching TV or cell phone R) | 3.52 ± 1.38 | 3.38 ± 1.42 | 3.64 ± 1.33 | 0.238 |
| Eat protein foods such as fish, legumes and eggs every day | 3.87 ± 0.96 | 3.72 ± 0.99 | 3.99 ± 0.93 | 0.079 |
| Eat a vegetable side dish at every meal | 3.93 ± 1.02 | 3.86 ± 1.03 | 3.99 ± 1.01 | 0.405 |
| Eat fruits every day | 3.88 ± 1.07 | 3.74 ± 1.04 | 4.00 ± 1.08 | 0.116 |
| Eat milk or dairy products (such as yogurt) every day | 3.75 ± 1.13 | 3.71 ± 1.07 | 3.78 ± 1.19 | 0.679 |
| Often eat fast food such as hamburgers, pizza, and chicken R) | 3.62 ± 0.97 | 3.51 ± 0.99 | 3.70 ± 0.96 | 0.211 |
| Total (100 point conversion) | 71.70 ± 10.76 | 70.66 ± 11.00 | 72.61 ± 10.47 | 0.246 |
Table 2.Comparison of high-sugar food consumption habits according to eating habit score tertiles of elementary school students in Daegu
Table 3.Comparison of high-sugar food consumption frequency according to eating habit score tertiles of elementary school students
Mean ± SD
Means with different lowercase letters in the same row are significantly different by Duncan’s multiple range test at P < 0.05.
Consumption frequency: 0, not at all; 2, 1-3/week; 5, 4-6/week; 7, 1/day 7; 14, 2/day
The higher the high-sugar food consumption frequency score, the higher the sugar consumption.
Table 4.Comparison of sweet taste intensity and sweet taste preference according to sweet taste assessment of elementary school students
| Items | Total (n = 164) | Unsweet1) (n = 34) | Normal (n = 37) | Sweet2) (n = 93) | P-value |
|---|---|---|---|---|---|
| Sweet taste intensity3) | |||||
| 0% | 1.79 ± 0.84 | 2.12 ± 0.97b | 2.11 ± 0.87b | 1.55 ± 0.70a | < 0.001 |
| 2.5% | 2.33 ± 1.05 | 2.53 ± 1.05ab | 2.70 ± 1.07b | 2.11 ± 0.99a | 0.006 |
| 5% | 3.57 ± 0.74 | 3.88 ± 0.76b | 3.76 ± 0.43b | 3.38 ± 0.77a | 0.001 |
| 10% | 4.37 ± 0.80 | 4.65 ± 0.69b | 4.62 ± 0.79b | 4.17 ± 0.78a | 0.001 |
| 20% | 4.52 ± 0.64 | 4.74 ± 0.51b | 4.86 ± 0.37b | 4.31 ± 0.69a | < 0.001 |
| Sweet taste preference4) | |||||
| 0% | 2.68 ± 1.35 | 3.59 ± 1.50b | 3.16 ± 1.32b | 2.16 ± 1.05a | < 0.001 |
| 2.5% | 3.03 ± 1.58 | 4.15 ± 2.04c | 3.35 ± 1.23b | 2.49 ± 1.25a | < 0.001 |
| 5% | 3.80 ± 1.57 | 2.94 ± 1.43a | 3.59 ± 1.01b | 3.44 ± 1.31a | < 0.001 |
| 10% | 3.80 ± 1.87 | 2.26 ± 1.23a | 3.08 ± 1.49b | 4.66 ± 1.72c | < 0.001 |
| 20% | 3.96 ± 1.25 | 2.38 ± 1.18a | 3.35 ± 1.20b | 4.78 ± 1.53c | < 0.001 |
| Sweet taste assessment5) | 3.55 ± 1.25 | 1.59 ± 0.50a | 3.00 ± 0.00b | 4.49 ± 0.53c | < 0.001 |
Mean ± SD
Means with different lowercase letters in the same row are significantly different by Duncan’s multiple range test at P < 0.05.
1)Unsweet: very unsweet and unsweet
2)Sweet: sweet and very sweet
3)Very unsweet 1, unsweet 2, normal 3, sweet 4, very sweet 5
4)Very dislike 1, dislike 2, so-so 3, like 4, very like 5
5)The higher the sweet taste assessment score, the higher the preference for sweetness.
Table 5.Comparison of eating habits, high-sugar food consumption habits, and frequency according to sweet taste assessment of elementary school students
| Items | Unsweet1) (n = 34) | Normal (n = 37) | Sweet2) (n = 93) | P-value |
|---|---|---|---|---|
| Eating habits3) | 74.6 ± 11.4b | 73.6 ± 9.4ab | 69.8 ± 10.6a | 0.036 |
| High-sugar food consumption habits4) | 15.2 ± 3.96a | 16.6 ± 4.95a | 18.7 ± 5.37b | 0.001 |
| High-sugar food consumption frequency5) | 17.5 ± 9.1a | 15.7 ± 9.8a | 29.8 ± 19.4b | < 0.001 |
Mean ± SD
Means with different lower case letters in the same row are significantly different by Duncan’s multiple range test at P < 0.05.
1)Unsweet: very unsweet and unsweet
2)Sweet: sweet and very sweet
3)The higher the score, the more desirable eating habits were formed.
4)The higher the high-sugar food consumption habit score, the higher the sugar consumption.
5)The higher the high-sugar food consumption frequency score, the higher the sugar consumption.
Table 6.Correlation between eating habits and sweet taste assessment and sugar-related variables in elementary school students
- 1. Ministry of Health and Welfare & The Korean Nutrition Society. Dietary reference intakes for Koreans 2020. Seoul: The Korean Nutrition Society; 2020.
- 2. World Health Organization. Guideline: Sugars intake for adults and children. Geneva: World Health Organization; 2015.
- 3. Bovi APD, Michele LD, Laino G, Vajro P. Obesity and obesity related diseases, sugar consumption and bad oral health: A fatal epidemic mixtures: The pediatric and odontologist point of view. Transl Med UniSa 2017; 16(1): 11-16.PubMedPMC
- 4. Vos MB, Kaar JL, Welsh JA, Van Horn LV, Feig DI, Anderson CAM, et al. Added sugars and cardiovascular disease risk in children: A scientific statement from the American heart association. Circulation 2017; 135(19): e1017-e1034.ArticlePubMedPMC
- 5. Ministry of Food and Drug Safety. Action plan for sugars reduction. Cheongju: Ministry of Food and Drug Safety; 2016.
- 6. Ministry of Food and Drug Safety. 2020 Food & Drug Statistical yearbook. Cheongju: Ministry of Food and Drug Safety; 2022.
- 7. Desor JA, Beacuchamp GK. Longitudinal changes in sweet preferences in humans. Physiol Behav 1987; 39(5): 639-641.ArticlePubMed
- 8. Mennella JA, Lukasewyz LD, Griffith JW, Beauchamp GK. Evaluation of the Monell forced-choice, paired-comparison tracking procedure for determining sweet taste preferences across the lifespan. Chem Senses 2011; 36(4): 345-355.ArticlePubMedPMC
- 9. Duffy VB, Peterson JM, Dinehart ME, Bartoshuk LM. Genetic and environmental variation in taste: Associations with sweet intensity, perference, and intake. Top Clin Nutr 2003; 18(4): 209-220.
- 10. Valentine S. Food and nutrition in the twenty-first century curriculum. Nutr Food Sci 2000; 30(3): 105-109.Article
- 11. Reither KP, Harris KJ, Paine-Andrews A, Fawcett SB, Schmid TL, Lankenau BH, et al. Measuring the health environment for physical activity and nutrition among youth: A review of the literature and applications for community initiatives. Prev Med 2000; 31(2): S98-S111.Article
- 12. Korea Health Industry Development Institute. National Food & Nutrition: Statistics commonly consumed food. Cheongju: Korea Health Industry Development Institute; 2018.
- 13. Lee KA. Comparison of sugar eating habits, sweet foods preference and intake frequency according to dietary habits in elementary school students. J Korean Pract Arts Educ 2018; 24(1): 95-110.Article
- 14. Kim JR, Lim HS. Relationships between children's Nutrition Quotient and the practice of the dietary guidelines of elementary school students and their mothers. J Nutr Health 2015; 48(1): 58-70.Article
- 15. Yu NH, Kim MJ, Han JS. A study on the food intake frequency, dietary habits and nutrition knowledge of middle school students who like sweets in Busan. J Korean Soc Food Sci Nutr 2007; 36(6): 735-744.Article
- 16. Ministry of Food and Drug Safety. Sweet taste assessment tool [internet]. Ministry of Food and Drug Safety; 2016 [cited 2019 Nov 1]. Available from: https://www.foodsafetykorea.go.kr/portal/healthyfoodlife/sweetProgram.do?menu_grp=MENU_NEW03&menu_no=2956#parish01
- 17. Son HN, Park MJ, Han JS. A study on dietary habits and food frequency of young children who like sweets. J Korean Diet Assoc 2009; 15(1): 10-21.
- 18. Lee HS, Kwon SO, Yon MY, Kim DH, Lee JY, Nam JW, et al. Dietary total sugar intake of Koreans: Based on the Korea National Health and Nutrition Examination Survey (KNHANES), 2008-2011. J Nutr Health 2014; 47(4): 268-276.Article
- 19. Her ES. Interrelations among snack preference, purchasing behaviors and intake in upper grade elementary school students: Compared by the gender and TV watching time. Korean J Community Nutr 2013; 18(5): 429-441.Article
- 20. Lee OH, Chang SO, Park MJ. Comparison of nutrition knowledge, dietary attitude and dietary habit in elementary school children with and without nutrition education. J Korean Soc Food Sci Nutr 2008; 37(11): 1427-1434.Article
- 21. Kim SY, Ryu SA. The relationship between beverage consumption, nutrient intake and body mass index in elementary school students in Gyeongnam area. J Nutr Health 2008; 41(6): 530-538.
- 22. Bucher D, Keller A, Laure J, Kruseman M. Sugar-sweetened beverages and obesity risk in children and adolescents: A systematic analysis on how methodological quality may influence conclusions. J Acad Nutr Diet 2016; 116(4): 638-659.ArticlePubMed
- 23. Kim DH. Nutrition knowledge and dietary behaviors for sugars and sodium intakes and assessments for sweet and salty taste in the fifth-grade elementary school students in Incheon [master's thesis]. Inha University; 2020.
- 24. Lee SJ. Analysis of the correlations of adolescents' salty taste assessment and sweet taste assessment with their dietary behaviors [master's thesis]. Kyungpook National University; 2016.
- 25. Kim MK. A study on the forming factors of elementary school students' eating habits. Korean J Health Educ 2020; 6(1): 105-130.Article
REFERENCES
Figure & Data
REFERENCES
Citations
Citations to this article as recorded by 
 Cite
CiteAssociation between eating habits, sweet taste assessment, and high-sugar food consumption among elementary school students in Daegu: a descriptive study

Fig. 1. Correlation between eating habits of parents and students
Fig. 1.
Association between eating habits, sweet taste assessment, and high-sugar food consumption among elementary school students in Daegu: a descriptive study
| Items | Total (n = 164) | Boys (n = 76) | Girls (n = 88) | P-value |
|---|---|---|---|---|
| Eat regularly scheduled meals | 3.46 ± 1.05 | 3.63 ± 1.05 | 3.32 ± 1.06 | 0.057 |
| Eat evenly without being picky | 3.59 ± 1.07 | 3.66 ± 1.04 | 3.52 ± 1.09 | 0.135 |
| Eat in moderation without overeating | 3.70 ± 0.90 | 3.64 ± 0.95 | 3.74 ± 0.86 | 0.508 |
| Eat always food less salty | 2.55 ± 0.99 | 2.47 ± 0.97 | 2.63 ± 1.01 | 0.332 |
| Eat while watching TV or cell phone |
3.52 ± 1.38 | 3.38 ± 1.42 | 3.64 ± 1.33 | 0.238 |
| Eat protein foods such as fish, legumes and eggs every day | 3.87 ± 0.96 | 3.72 ± 0.99 | 3.99 ± 0.93 | 0.079 |
| Eat a vegetable side dish at every meal | 3.93 ± 1.02 | 3.86 ± 1.03 | 3.99 ± 1.01 | 0.405 |
| Eat fruits every day | 3.88 ± 1.07 | 3.74 ± 1.04 | 4.00 ± 1.08 | 0.116 |
| Eat milk or dairy products (such as yogurt) every day | 3.75 ± 1.13 | 3.71 ± 1.07 | 3.78 ± 1.19 | 0.679 |
| Often eat fast food such as hamburgers, pizza, and chicken |
3.62 ± 0.97 | 3.51 ± 0.99 | 3.70 ± 0.96 | 0.211 |
| Total (100 point conversion) | 71.70 ± 10.76 | 70.66 ± 11.00 | 72.61 ± 10.47 | 0.246 |
| Items | Total (n = 164) | T1 (n = 55) | T2 (n = 55) | T3 (n = 54) | P-value |
|---|---|---|---|---|---|
| Eating sweet food makes me feel better. | 3.28 ± 1.04 | 3.36 ± 0.91 | 3.42 ± 1.01 | 3.06 ± 1.15 | 0.145 |
| Drink more sugary drinks, such as soda or fruit juice, rather than water when thirsty | 2.15 ± 1.12 | 2.75 ± 1.12c | 2.09 ± 1.14b | 1.61 ± 0.76a | < 0.001 |
| Drink sweeter milk such as chocolate milk or banana milk more often than white milk | 2.45 ± 1.19 | 2.89 ± 1.30b | 2.42 ± 1.16a | 2.02 ± 0.96a | 0.001 |
| Eat fruit juice more often than fresh fruit | 2.23 ± 1.12 | 2.55 ± 1.19b | 2.22 ± 1.08ab | 1.91 ± 1.01a | 0.012 |
| Spread a lot of jam, when eating bread | 2.55 ± 1.18 | 2.84 ± 1.16b | 2.64 ± 1.20b | 2.17 ± 1.11a | 0.010 |
| There are always sweets or sweet drinks in my house. | 2.57 ± 1.14 | 2.91 ± 1.26b | 2.58 ± 1.13ab | 2.20 ± 0.89a | 0.005 |
| Often eat sweet foods in our house | 2.30 ± 0.99 | 2.76 ± 1.05c | 2.29 ± 0.93b | 1.83 ± 0.74a | < 0.001 |
| Total | 17.5 ± 5.20 | 20.0 ± 5.27c | 17.6 ± 4.92b | 14.8 ± 4.01a | < 0.001 |
| Items | Total (n = 164) | T1 (n = 55) | T2 (n = 55) | T3 (n = 54) | P-value |
|---|---|---|---|---|---|
| Carbonated drink | 1.43 ± 2.25 | 2.04 ± 2.86b | 1.35 ± 2.26a | 0.91 ± 1.13a | 0.029 |
| Fruit juice/fruit flavored drink | 1.70 ± 2.62 | 2.04 ± 2.48b | 1.62 ± 2.42ab | 1.44 ± 2.94a | 0.482 |
| Sweetened milk | 0.95 ± 1.81 | 1.35 ± 2.42b | 0.91 ± 1.45a | 0.57 ± 1.29a | 0.083 |
| Soy milk | 0.66 ± 1.83 | 0.51 ± 1.50a | 0.42 ± 0.97a | 1.06 ± 2.59b | 0.144 |
| Drinking yogurt | 1.90 ± 2.28 | 1.82 ± 2.49 | 1.85 ± 2.21 | 2.04 ± 2.15 | 0.868 |
| Scooped yogurt | 1.18 ± 1.91 | 1.25 ± 2.33 | 0.89 ± 1.35 | 1.41 ± 1.92 | 0.352 |
| Other drinks | 1.78 ± 2.50 | 2.84 ± 3.09b | 1.44 ± 2.38a | 1.06 ± 1.36a | < 0.001 |
| Ice cream | 1.88 ± 2.46 | 2.20 ± 2.74b | 2.24 ± 2.76ab | 1.20 ± 1.54a | 0.045 |
| Sweet bread | 1.51 ± 2.18 | 1.55 ± 1.74 | 1.80 ± 2.92 | 1.19 ± 1.63 | 0.338 |
| Cookies/snacks | 2.40 ± 2.36 | 2.55 ± 2.03 | 2.87 ± 3.00 | 1.76 ± 1.72 | 0.039 |
| Cereals | 1.88 ± 2.43 | 2.40 ± 2.87 | 1.82 ± 2.14 | 1.41 ± 2.15 | 0.101 |
| Candy/jelly/caramal | 2.09 ± 2.67 | 2.55 ± 2.72b | 2.35 ± 3.21ab | 1.37 ± 1.71a | 0.048 |
| Chocolate | 1.81 ± 2.67 | 1.98 ± 2.99b | 2.36 ± 3.03ab | 1.07 ± 1.58a | 0.034 |
| Tteokbokki | 1.63 ± 1.69 | 2.04 ± 1.90 | 1.31 ± 1.42 | 1.54 ± 1.64 | 0.068 |
| Seasoned chicken/dak gangjeong | 1.27 ± 1.85 | 2.04 ± 2.52 | 0.91 ± 1.25 | 0.85 ± 1.25 | 0.001 |
| Total | 24.7 ± 17.1 | 29.1 ± 16.5b | 24.1 ± 19.6a | 18.8 ± 13.3a | 0.007 |
| Items | Total (n = 164) | Unsweet |
Normal (n = 37) | Sweet |
P-value |
|---|---|---|---|---|---|
| Sweet taste intensity |
|||||
| 0% | 1.79 ± 0.84 | 2.12 ± 0.97b | 2.11 ± 0.87b | 1.55 ± 0.70a | < 0.001 |
| 2.5% | 2.33 ± 1.05 | 2.53 ± 1.05ab | 2.70 ± 1.07b | 2.11 ± 0.99a | 0.006 |
| 5% | 3.57 ± 0.74 | 3.88 ± 0.76b | 3.76 ± 0.43b | 3.38 ± 0.77a | 0.001 |
| 10% | 4.37 ± 0.80 | 4.65 ± 0.69b | 4.62 ± 0.79b | 4.17 ± 0.78a | 0.001 |
| 20% | 4.52 ± 0.64 | 4.74 ± 0.51b | 4.86 ± 0.37b | 4.31 ± 0.69a | < 0.001 |
| Sweet taste preference |
|||||
| 0% | 2.68 ± 1.35 | 3.59 ± 1.50b | 3.16 ± 1.32b | 2.16 ± 1.05a | < 0.001 |
| 2.5% | 3.03 ± 1.58 | 4.15 ± 2.04c | 3.35 ± 1.23b | 2.49 ± 1.25a | < 0.001 |
| 5% | 3.80 ± 1.57 | 2.94 ± 1.43a | 3.59 ± 1.01b | 3.44 ± 1.31a | < 0.001 |
| 10% | 3.80 ± 1.87 | 2.26 ± 1.23a | 3.08 ± 1.49b | 4.66 ± 1.72c | < 0.001 |
| 20% | 3.96 ± 1.25 | 2.38 ± 1.18a | 3.35 ± 1.20b | 4.78 ± 1.53c | < 0.001 |
| Sweet taste assessment |
3.55 ± 1.25 | 1.59 ± 0.50a | 3.00 ± 0.00b | 4.49 ± 0.53c | < 0.001 |
| Items | Unsweet |
Normal (n = 37) | Sweet |
P-value |
|---|---|---|---|---|
| Eating habits |
74.6 ± 11.4b | 73.6 ± 9.4ab | 69.8 ± 10.6a | 0.036 |
| High-sugar food consumption habits |
15.2 ± 3.96a | 16.6 ± 4.95a | 18.7 ± 5.37b | 0.001 |
| High-sugar food consumption frequency |
17.5 ± 9.1a | 15.7 ± 9.8a | 29.8 ± 19.4b | < 0.001 |
| Items | Eating habits |
Sweet taste assessment |
||
|---|---|---|---|---|
| Correlation | P-value | Correlation | P-value | |
| High-sugar food consumption habits | -0.461 | < 0.001 | 0.291 | < 0.001 |
| High-sugar food consumption frequency | -0.316 | < 0.001 | 0.350 | < 0.001 |
| Sweet taste assessment | -0.180 | 0.021 | ||
Table 1. Eating habits of elementary school students
Mean ± SD Means with different lowercase letters in the same row are significantly different by Duncan’s multiple range test at reverse response; 5-point Likert scale: The higher the score, the more desirable eating habits were formed.
Table 2. Comparison of high-sugar food consumption habits according to eating habit score tertiles of elementary school students in Daegu
Mean ± SD Means with different lowercase letters in the same row are significantly different by Duncan’s multiple range test at 5-point Likert scale: The higher the high-sugar food consumption habit score, the higher the sugar consumption.
Table 3. Comparison of high-sugar food consumption frequency according to eating habit score tertiles of elementary school students
Mean ± SD Means with different lowercase letters in the same row are significantly different by Duncan’s multiple range test at Consumption frequency: 0, not at all; 2, 1-3/week; 5, 4-6/week; 7, 1/day 7; 14, 2/day The higher the high-sugar food consumption frequency score, the higher the sugar consumption.
Table 4. Comparison of sweet taste intensity and sweet taste preference according to sweet taste assessment of elementary school students
Mean ± SD Means with different lowercase letters in the same row are significantly different by Duncan’s multiple range test at Unsweet: very unsweet and unsweet Sweet: sweet and very sweet Very unsweet 1, unsweet 2, normal 3, sweet 4, very sweet 5 Very dislike 1, dislike 2, so-so 3, like 4, very like 5 The higher the sweet taste assessment score, the higher the preference for sweetness.
Table 5. Comparison of eating habits, high-sugar food consumption habits, and frequency according to sweet taste assessment of elementary school students
Mean ± SD Means with different lower case letters in the same row are significantly different by Duncan’s multiple range test at Unsweet: very unsweet and unsweet Sweet: sweet and very sweet The higher the score, the more desirable eating habits were formed. The higher the high-sugar food consumption habit score, the higher the sugar consumption. The higher the high-sugar food consumption frequency score, the higher the sugar consumption.
Table 6. Correlation between eating habits and sweet taste assessment and sugar-related variables in elementary school students


