
Articles
- Page Path
- HOME > Korean J Community Nutr > Volume 17(4); 2012 > Article
-
Original Article
- Evaluation of Nutrient Intake and Anthropometric Parameters related to Obesity in Korean Female Adolescents according to Dietary Diversity Score: From the Korean National Health and Nutrition Examination Surveys, 2007-2009
- Yun-Jung Bae
-
Korean Journal of Community Nutrition 2012;17(4):419-428.
DOI: https://doi.org/10.5720/kjcn.2012.17.4.419
Published online: August 31, 2012
Department of Food and Nutritional Sciences, Hanbuk University, Gyeonggi, Korea.
- Corresponding author: Yun Jung Bae, Hanbuk University, 233-1 Sangpae-dong, Dongducheon-si, Gyeonggi-do 483-120, Korea. Tel: (031) 860-1445, Fax: (031) 860-1449, byj@hanbuk.ac.kr
• Received: February 29, 2012 • Revised: April 18, 2012 • Accepted: August 8, 2012
Copyright © 2012 The Korean Society of Community Nutrition
- 1,863 Views
- 3 Download
- 12 Crossref

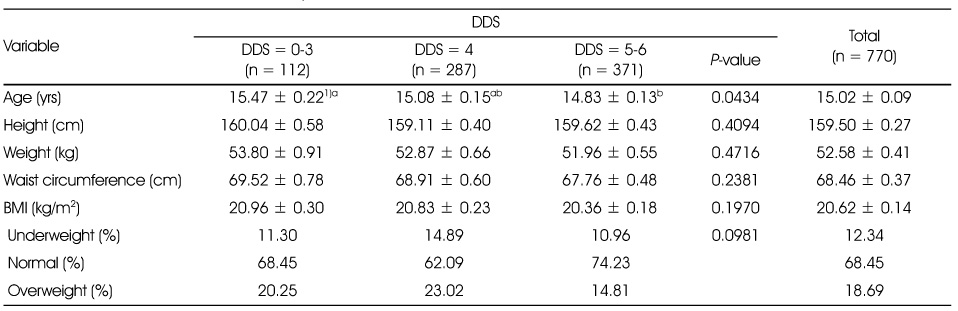
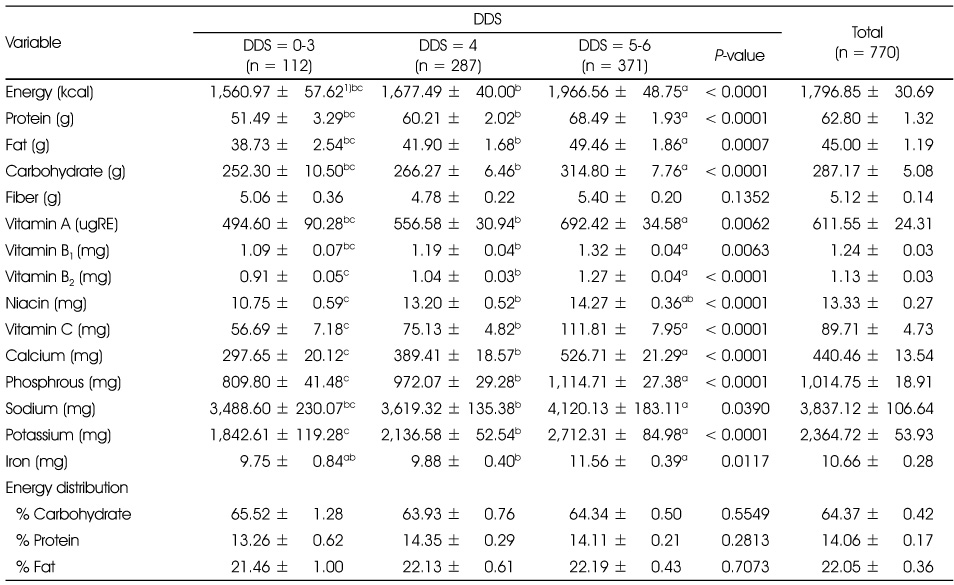
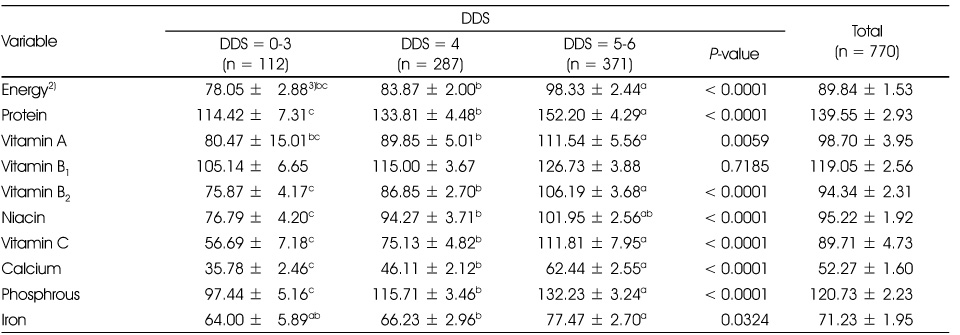
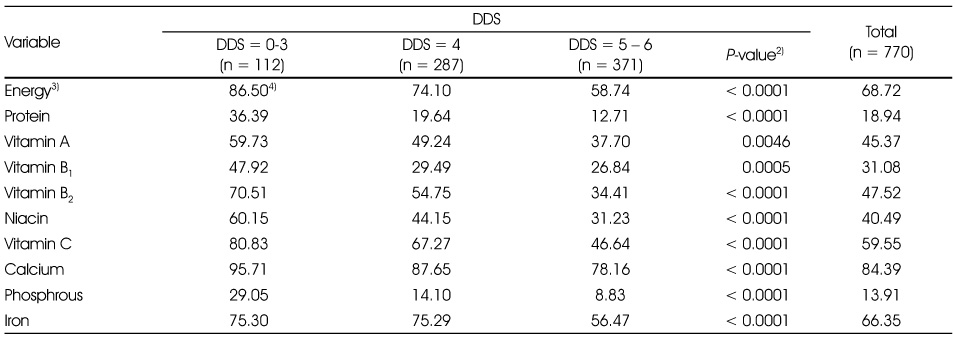
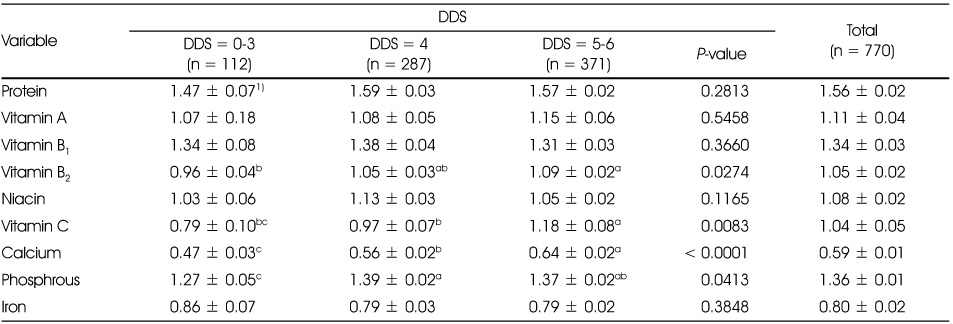
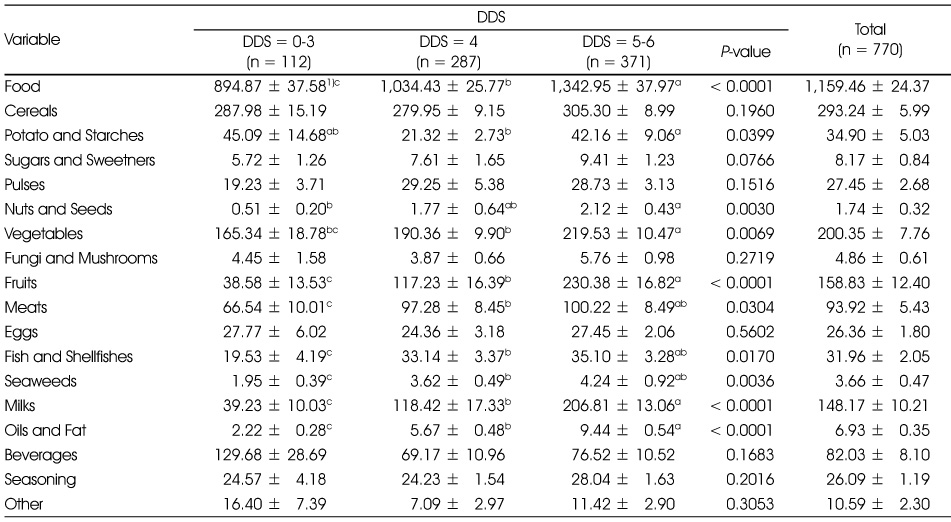
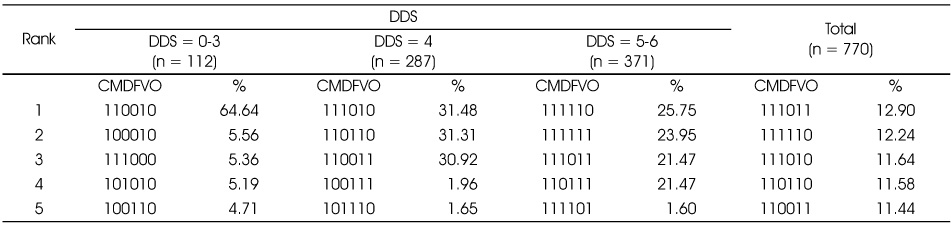
Figure & Data
REFERENCES
Citations
Citations to this article as recorded by 
- Integrated analysis of nutrition profiles and dried blood spot proteomics reveals patterns associated with autism spectrum disorder
Hoshik Kwon, Su-In Yoon, Sooyeon Baek, Yerin Hyun, Ju Yeon Kim, Dong Hui Park, Jiyoung Yu, Jin Ah Cho, Hyo-Won Kim, Kyunggon Kim
Nutritional Neuroscience.2026; : 1. CrossRef - Evaluation of Dietary Nutrient Intake and Food Variety by Milk Consumption in Postmenopausal Korean Women: Data Based on the Korea National Health and Nutrition Examination Survey 2013~2015
Ae Wha Ha, Woo Kyung Kim, Sun Hyo Kim
Journal of the Korean Society of Food Science and Nutrition.2022; 51(9): 912. CrossRef - Relationship between dietary diversity score and general health in female students
Azadeh AMINIANFAR, Fereydoun SIASSI, Mostafa QORBANI, Javad KARIMI, Gity SOTOUDEH, Yas KALIKIAS, Sanaz SOLTANI
Minerva Pediatrics.2021;[Epub] CrossRef - Index of Nutritional Quality (INQ) and the Risk of Obesity in Male Adolescents: a Case-Control Study
Maryam Gholamalizadeh, Samira Rastgoo, Saeid Doaei, Farhad Vahid, Hanieh Malmir, Narges Ashoori, Alireza Mosavi Jarrahi
Biological Trace Element Research.2021; 199(5): 1701. CrossRef - Relationship between dietary intakes and the double burden of malnutrition in adults of Malang, Indonesia: An exploratory study
Soo Jin Lee, Ho Kyung Ryu
Nutrition Research and Practice.2018; 12(5): 426. CrossRef - Night eating status according to body mass index of Korean adolescents
Mi-Kyeong Choi, Yu-Jin Cho, Myung-Hee Kim, Yun Jung Bae
Nutrition & Food Science.2017; 47(1): 89. CrossRef - Systematic Review on the Study of the Childhood and Adolescent Obesity in Korea: Dietary Risk Factors
Eun Jeong Heo, Jae Eun Shim, Eun Young Yoon
Korean Journal of Community Nutrition.2017; 22(3): 191. CrossRef - Development of NQ-A, Nutrition Quotient for Korean Adolescents, to assess dietary quality and food behavior
Hye-Young Kim, Jung-Sug Lee, Ji-Yun Hwang, Sehyug Kwon, Hae Rang Chung, Tong-Kyung Kwak, Myung-Hee Kang, Young-Sun Choi
Journal of Nutrition and Health.2017; 50(2): 142. CrossRef - Comparison of Diet Quality and Diversity according to Obesity Type among 19-64 year old Korean Adults
Hyae Min Gu, So Yeon Ryu, Jong Park, Mi Ah Han, Yeong Eun Son
Korean Journal of Community Nutrition.2016; 21(6): 545. CrossRef - Effects of brown rice-vegetable school meal program on subjective health status, BMI and hematological parameters among high school students
Kyoung-Ja Moon, Hye-Young Kim
Journal of the Korea Academia-Industrial cooperation Society.2015; 16(11): 7385. CrossRef - Evaluation of the Nutritional Value of Traditional Korean Noodles through Energy Density and Diversity
YoonKyoung Yang, SungOk Kim, Juhyeon Kim
The Korean Journal of Food And Nutrition.2014; 27(4): 732. CrossRef - Effects of a Brown Rice and Vegetable Diet on the Defecation Conditions and Health Status of High School Students
Hye Young Kim
Journal of Korean Public Health Nursing.2013; 27(1): 179. CrossRef
 Cite
Cite- Figure
-
- We recommend
- Related articles
-
- Changing patterns and related factors of kimchi consumption among Korean adults: a nationwide cross-sectional analysis of the Korea National Health and Nutrition Examination Survey, 2010–2024
- Differences in lunch nutrient intake and nutritional adequacy among Korean older adults by meal site: a cross-sectional analysis of the 2018–2021 Korea National Health and Nutrition Examination Survey data
- Association between nutrient intake and frailty status in Korean older adults: a cross-sectional study using the 9th (2022–2023) Korea National Health and Nutrition Examination Survey
- Comparison of dietary behaviors and nutrient intake by gender and household type among older Koreans: a cross-sectional study using data from the 8th Korea National Health and Nutrition Examination Survey
- Ultra-processed food intake and dietary behaviors in Korean adolescents: a cross-sectional study based on the 2019–2023 Korea National Health and Nutrition Examination Survey
Evaluation of Nutrient Intake and Anthropometric Parameters related to Obesity in Korean Female Adolescents according to Dietary Diversity Score: From the Korean National Health and Nutrition Examination Surveys, 2007-2009
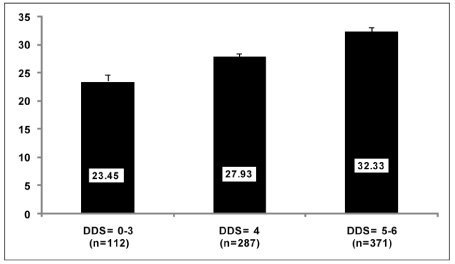
Fig. 1
Dietary Variety Score (DVS) of the subjects.
Fig. 1
Evaluation of Nutrient Intake and Anthropometric Parameters related to Obesity in Korean Female Adolescents according to Dietary Diversity Score: From the Korean National Health and Nutrition Examination Surveys, 2007-2009
General characteristics of the subjects
1) Mean ± SE (Means with different superscript letters are significantly different from each other by Tukey's test.)
All variables have been age-adjusted expect age.
Dietary intakes of the subjects
1) Mean ± SE (Means with different superscript letters are significantly different from each other by Tukey's test.)
All variables have been age-adjusted.
The percent of RNI1) of the subjects
1) Recommend Nutrient Intake
2) Estimated Energy Requirement was used
3) Mean ± SE (Means with different superscript letters are significantly different from each other by Tukey's test.)
All variables have been age-adjusted.
The percent of the subjects consumed under EAR1) of the subjects
1) Estimated Average Requirement
2) Significance as determined by χ2-test
3) Estimated Energy Requirement was used
4) %
Index of Nutritional Quality (INQ) of the subjects
1) Mean ± SE (Means with different superscript letters are significantly different from each other by Tukey's test.)
All variables have been age-adjusted.
Food intakes from each food group in subjects (g/day)
1) Mean ± SE (Means with different superscript letters are significantly different from each other by Tukey's test.)
All variables have been age-adjusted.
Distribution of food group intake pattern (CMDFVO)1) of the subjects
1) CMDFVO: cereals, meats, dairys, fruits, vegetables, fats and oils food group
1: food group(s) present, 0: food group(s) absent
For example, CMDFVO = 111111 denotes that all food group (cereals, meats, dairys, fruits, vegetables, fats and oils food group) were consumed
Table 1
General characteristics of the subjects
1) Mean ± SE (Means with different superscript letters are significantly different from each other by Tukey's test.) All variables have been age-adjusted expect age.
Table 2
Dietary intakes of the subjects
1) Mean ± SE (Means with different superscript letters are significantly different from each other by Tukey's test.) All variables have been age-adjusted.
Table 3
The percent of RNI1) of the subjects
1) Recommend Nutrient Intake 2) Estimated Energy Requirement was used 3) Mean ± SE (Means with different superscript letters are significantly different from each other by Tukey's test.) All variables have been age-adjusted.
Table 4
The percent of the subjects consumed under EAR1) of the subjects
1) Estimated Average Requirement 2) Significance as determined by χ2-test 3) Estimated Energy Requirement was used 4) %
Table 5
Index of Nutritional Quality (INQ) of the subjects
1) Mean ± SE (Means with different superscript letters are significantly different from each other by Tukey's test.) All variables have been age-adjusted.
Table 6
Food intakes from each food group in subjects (g/day)
1) Mean ± SE (Means with different superscript letters are significantly different from each other by Tukey's test.) All variables have been age-adjusted.
Table 7
Distribution of food group intake pattern (CMDFVO)1) of the subjects
1) CMDFVO: cereals, meats, dairys, fruits, vegetables, fats and oils food group 1: food group(s) present, 0: food group(s) absent For example, CMDFVO = 111111 denotes that all food group (cereals, meats, dairys, fruits, vegetables, fats and oils food group) were consumed


