
Articles
- Page Path
- HOME > Korean J Community Nutr > Volume 17(4); 2012 > Article
-
Original Article
- Characteristics of the Health Factors in 45~60 Year Old Korean Women related to Menopausal Stages: Based on 2008~2009 Korean National Health and Nutrition Examination Survey
- Hye-Jin Lee, Kwang-Hyun Cho, Kyung-Hea Lee
-
Korean Journal of Community Nutrition 2012;17(4):450-462.
DOI: https://doi.org/10.5720/kjcn.2012.17.4.450
Published online: August 31, 2012
Department of Food and Nutrition, Changwon National University, Gyeongnam, Korea.
1Department of Basic Sciences, Changwon National University, Gyeongnam, Korea.
- Corresponding author: Kyung-Hea Lee, Department of Food and Nutrition, Changwon National University, 9 Sarim-Dong, Uichanggu, Changwon, Gyeongnam 641-773, Korea. Tel: (055) 213-3514, Fax: (055) 281-7480, khl@changwon.ac.kr
• Received: June 1, 2012 • Revised: July 19, 2012 • Accepted: August 21, 2012
Copyright © 2012 The Korean Society of Community Nutrition
- 1,719 Views
- 2 Download
- 1 Crossref
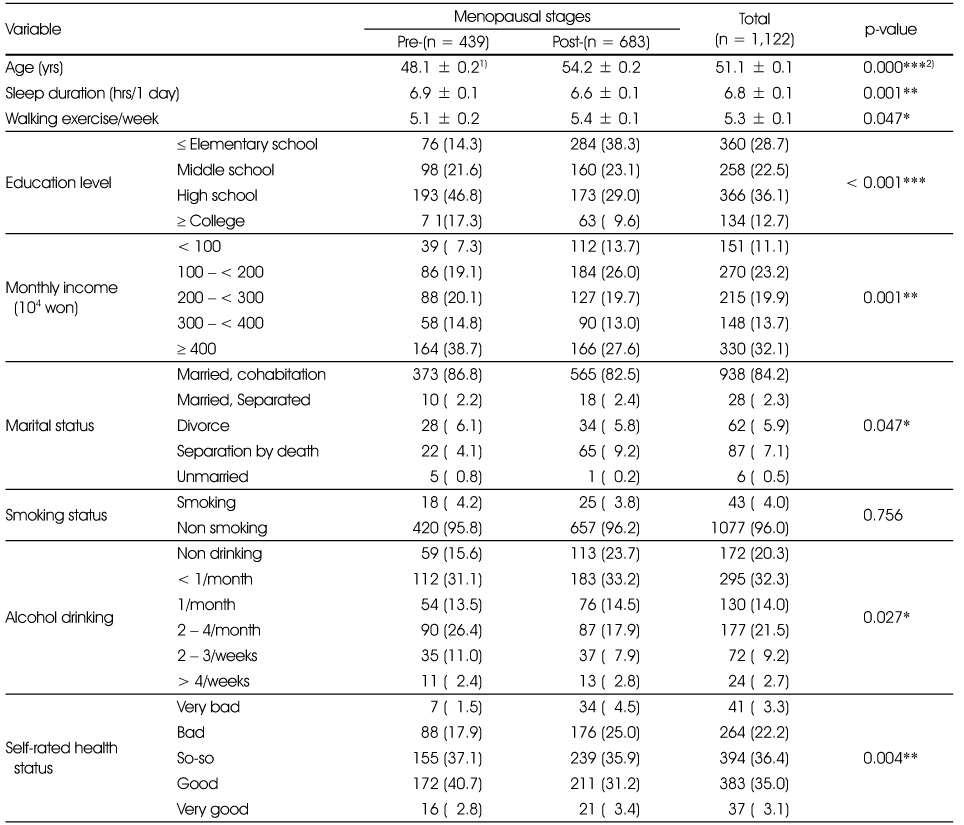
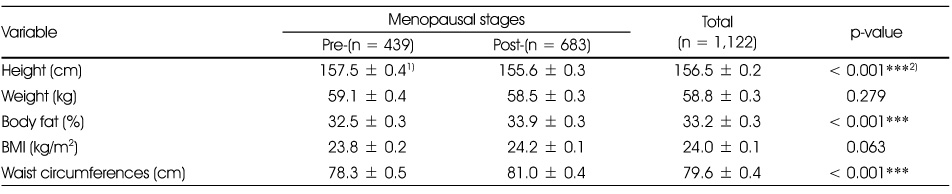
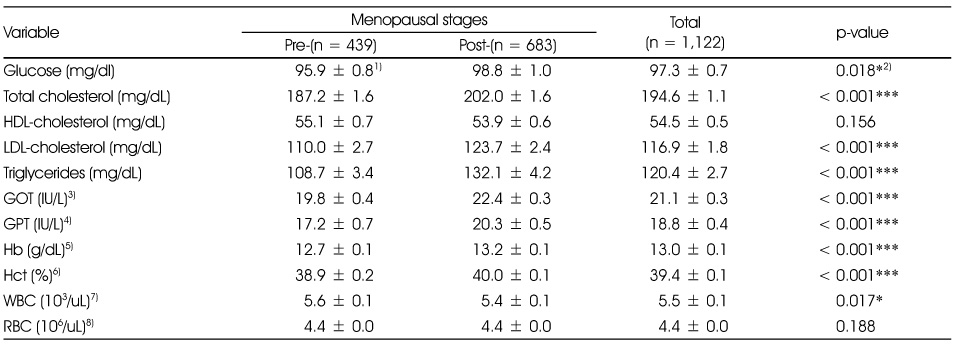
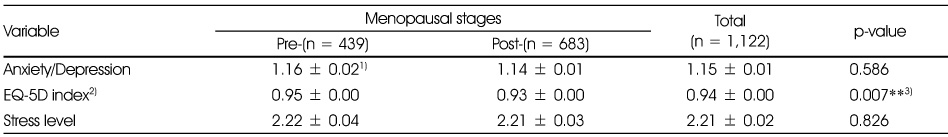
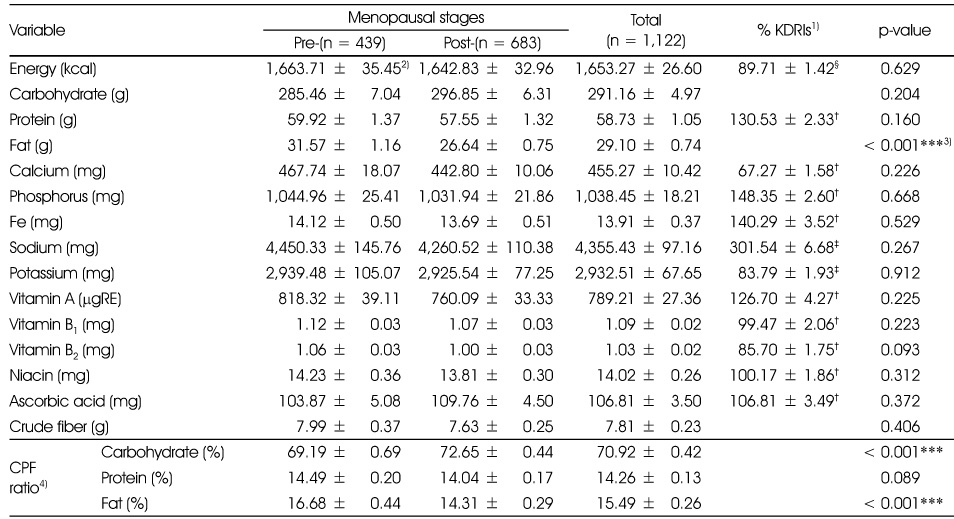
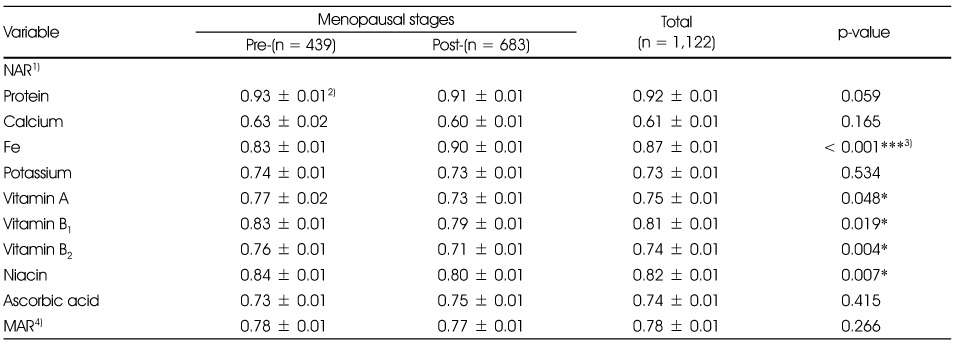
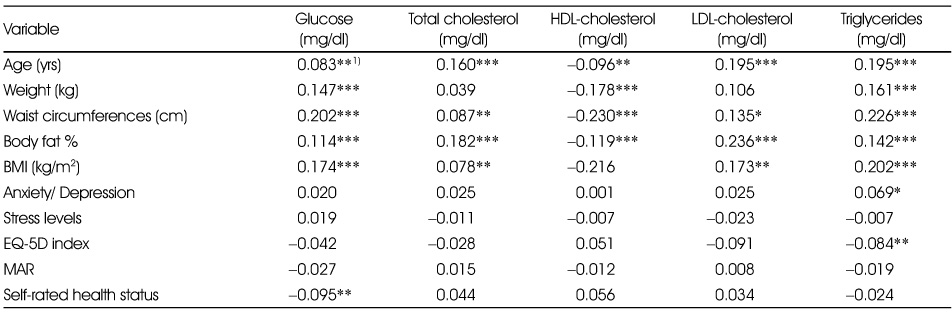
Figure & Data
REFERENCES
Citations
Citations to this article as recorded by 
- Analysis of Physical Characteristics and Nutrient Intakes according to Menopause and Number of Years Passed Using National Health and Nutrition Survey (2013-2019) Data
Su Gyung Kim, Bok-Mi Jung
The Korean Journal of Community Living Science.2023; 34(2): 235. CrossRef
 Cite
Cite- We recommend
- Related articles
-
- Comparison of dietary behaviors and nutrient intake by gender and household type among older Koreans: a cross-sectional study using data from the 8th Korea National Health and Nutrition Examination Survey
- Ultra-processed food intake and dietary behaviors in Korean adolescents: a cross-sectional study based on the 2019–2023 Korea National Health and Nutrition Examination Survey
- The dietary factors associated with sleep duration in postmenopausal middle-aged women: a cross-sectional study using 2019–2023 Korea National Health and Nutrition Examination Survey data
- Trends in growth and nutritional status of Korean toddlers and preschoolers: a cross-sectional study using 2010–2021 Korea National Health and Nutrition Examination Survey data
- Biochemical characteristics, nutrient intakes, and chronic disease risk according to the dietary fat energy ratio in middle-aged Korean: a cross-sectional study using data from the 7th (2016–2018) Korean National Health and Nutrition Examination Survey
Characteristics of the Health Factors in 45~60 Year Old Korean Women related to Menopausal Stages: Based on 2008~2009 Korean National Health and Nutrition Examination Survey
Characteristics of the Health Factors in 45~60 Year Old Korean Women related to Menopausal Stages: Based on 2008~2009 Korean National Health and Nutrition Examination Survey
General and life style characteristics by menopausal stages
1) Values are Mean ± SE or N (%)
2) by t-test or chi-square test (*: p<0.05, **: p<0.01, ***: p<0.001)
Anthropometric characteristics by menopausal stages
1) Values are Mean ± SE
2) by t-test (***: p < 0.001)
Serum biochemical values by menopausal stages
1) Values are Mean ± SE
2) by t-test (*: p < 0.05, ***: p < 0.001)
3) GOT: Glutamic oxaloacetate transaminase
4) GPT: Glutamate pyruvate transaminase
5) Hb: Hemoglobin
6) Hct: Hematocrit
7) WBC: White blood cell
8) RBC: Red blood cell
Mental health by menopausal stages
1) Values are Mean ± SE
2) EQ-5D index: EuroQo1-5Dimension index
3) by t-test (**: p < 0.01)
Average daily nutrient intakes and KDRIs % by menopausal stages
1) KDRIs: Dietary Reference Intakes for Koreans
2) Values are Mean ± SE
3) by t-test (***: p < 0.001)
4) Intaked energy distribution ratio of carbohydrate:protein:fat
§: Estimated Average Requirement (EAR), †: Recommended Intake (RI), ‡: Adequate Intake (AI)
NAR and MAR values of nutrients by menopausal stages
1) NAR: Nutrient Adequacy Ratio
2) Values are Mean ± SE
3) by t-test (*: p < 0.05, ***: p < 0.001)
4) MAR: Mean Adequacy Ratio
Correlation coefficients between health indicators and related factors in middle-aged women
1) by Pearson's correlation (*: p < 0.05, **: p < 0.01, ***: p < 0.001)
Table 1
General and life style characteristics by menopausal stages
1) Values are Mean ± SE or N (%) 2) by t-test or chi-square test (*: p<0.05, **: p<0.01, ***: p<0.001)
Table 2
Anthropometric characteristics by menopausal stages
1) Values are Mean ± SE 2) by t-test (***: p < 0.001)
Table 3
Serum biochemical values by menopausal stages
1) Values are Mean ± SE 2) by t-test (*: p < 0.05, ***: p < 0.001) 3) GOT: Glutamic oxaloacetate transaminase 4) GPT: Glutamate pyruvate transaminase 5) Hb: Hemoglobin 6) Hct: Hematocrit 7) WBC: White blood cell 8) RBC: Red blood cell
Table 4
Mental health by menopausal stages
1) Values are Mean ± SE 2) EQ-5D index: EuroQo1-5Dimension index 3) by t-test (**: p < 0.01)
Table 5
Average daily nutrient intakes and KDRIs % by menopausal stages
1) KDRIs: Dietary Reference Intakes for Koreans 2) Values are Mean ± SE 3) by t-test (***: p < 0.001) 4) Intaked energy distribution ratio of carbohydrate:protein:fat §: Estimated Average Requirement (EAR), †: Recommended Intake (RI), ‡: Adequate Intake (AI)
Table 6
NAR and MAR values of nutrients by menopausal stages
1) NAR: Nutrient Adequacy Ratio 2) Values are Mean ± SE 3) by t-test (*: p < 0.05, ***: p < 0.001) 4) MAR: Mean Adequacy Ratio
Table 7
Correlation coefficients between health indicators and related factors in middle-aged women
1) by Pearson's correlation (*: p < 0.05, **: p < 0.01, ***: p < 0.001)


