
Articles
- Page Path
- HOME > Korean J Community Nutr > Volume 20(1); 2015 > Article
-
Research Article
- An Evaluation of Chronic Disease Risk Based on the Percentage of Energy from Carbohydrates and the Frequency of Vegetable Intake in the Korean Elderly: Using the 2007-2009 Korea National Health and Nutrition Examination Survey
- Yoon Suk Suh, Min Seon Park, Young-Jin Chung
-
Korean Journal of Community Nutrition 2015;20(1):41-52.
DOI: https://doi.org/10.5720/kjcn.2015.20.1.41
Published online: February 28, 2015
1Graduate School of Education, Chungnam National University, Daejeon, Korea.
2Department of Food and Nutrition, Chungnam National University, Daejeon, Korea.
- Corresponding author: Young-Jin Chung. Department of Food and Nutrition, College of Human Ecology, Chungnam National University, 99 Daehak-ro(St), Yusong-gu, Daejeon 305-764, Korea. Tel: (042) 821-6833, Fax: (042) 821-8887, yjchung@cnu.ac.kr
• Received: January 26, 2015 • Revised: February 25, 2015 • Accepted: February 26, 2015
Copyright © 2015 The Korean Society of Community Nutrition
This is an Open-Access article distributed under the terms of the Creative Commons Attribution Non-Commercial License (http://creativecommons.org/licenses/by-nc/3.0/) which permits unrestricted non-commercial use, distribution, and reproduction in any medium, provided the original work is properly cited.
- 1,954 Views
- 0 Download
- 7 Crossref
Abstract
-
Objectives
- Korean elderly people are known to consume diets high in carbohydrates low in vegetables compared to other age groups. This study evaluated the chronic disease risks and nutritional status in this group based on the percentage of energy from carbohydrates and the frequency of vegetable intake.
-
Methods
- Using the 2007~2009 Korean National Health Nutrition Examination Survey data, except those who were undergoing treatment for chronic disease, final 1,487 subjects aged 65 and older were divided into 4 groups: moderate carbohydrate energy ratio of 55~70% and low frequency of vegetable intake defined as less than 5 times per day (MCLV), moderate carbohydrate ratio and high frequency of vegetable intake more than 5 times (MCHV), high carbohydrate energy ratio above 70% and low frequency of vegetable intake less than 5 times (HCLV), and high carbohydrate ratio and high frequency of vegetable intake more than 5 times (HCHV). All data were analyzed after the application of weighted value, using a general linear model or logistic regression.
-
Results
- More than half of Korean elderly consumed diets with HCLV, and this group showed poor nutritional status and lower frequency of intake of most food items, but with no risk of chronic disease such as diabetes, obesity, hypertension, cardiovascular disease or anemia probably due to low intake of energy. On the contrary, MCHV group with a high percentage of energy from fat and protein showed the highest intake of energy and most nutrients, the highest frequency of intake of most of food items and a tendency of high risk of abdominal obesity, being followed by the MCLV group. Meanwhile, HCHV group showed a tendency of high risk of hypertension, followed by HCLV group with low frequency of intake of vegetables compared with the two moderate carbohydrate groups.
-
Conclusions
- The results suggested that the percentage of energy from carbohydrate and the frequency of vegetable intake affected the nutritional status, but not significantly affected the risk of chronic disease in Korean elderly. Further studies using more detailed category of % energy from carbohydrates and of type and amount of vegetables with consideration of individual energy intake level, excessive or deficient, are needed to confirm the results.
- 1. Cooper AJ, Forouhi NG, Ye Z, Buijsse B, Arriola L, Balkau B, Barricarte A, Beulens JWJ, Boeing H, Büchner FL, Dahm CC, Lauzon-Guillain B, Fagherazzi G, Franks PW, Gonzalez C, Grioni S, Kaaks R, Key TJ, Masala G, Navarro C, Nilsson P, Overvad K, Panico S, Ramón Quirós J, Rolandsson O, Roswall N, Sacerdote C, Sánchez M-J, Slimani N, Sluijs I, Spijkerman AMW, Teucher B, Tjonneland A, Tumino R, Sharp SJ, Langenberg C, Feskens EJM, Riboli E, Wareham NJ. The InterAct Consortium. Fruit and vegetable intake and type 2 diabetes: EPIC-InterAct prospective study and meta-analysis. Eur J Clin Nutr 2012; 66(10): 1082-1092.ArticlePubMedPMCPDF
- 2. Choi MK, Bae YJ. A study on blood lipids and blood pressure of adult men and women according to vegetable intake. Korean J Community Nutr 2007; 12(6): 761-772.
- 3. Esmaillzadeh A, Kimiagar M, Mehrabi Y, Azadbakht L, Hu FB, Willett WC. Fruit and vegetable intakes, C-reactive protein and the metabolic syndrome. Am J Clin Nutr 2006; 84(6): 1489-1497.ArticlePubMed
- 4. Kang M, Joung HJ, Lim JH, Lee YS, Song YJ. Secular trend in dietary patterns in a Korean adult population using the 1998, 2001, and 2005 Korean national health and nutrition examination Survey. Korean J Nutr 2011; 44(2): 152-161.Article
- 5. Kim J, Jo I, Joung H. A rice-based traditional dietary pattern is associated with obesity in Korean adults. J Acad Nutr Diet 2012; 112(2): 246-253.ArticlePubMed
- 6. Kim Y. Food and nutrient consumption patterns of Korean adults by socioeconomic status. Korean J Community Nutr 2001; 6(4): 645-656.
- 7. Kwon JH, Shim JE, Park MK, Paik HY. Evaluation of fruits and vegetables intake for prevention of chronic disease in Korean adults aged 30 years and over: using the third Korea National Health and Nutrition Examination Survey(KNHANES III) 2005. Korean J Nutr 2009; 42(2): 146-157.Article
- 8. Mann J. Dietary carbohydrate: relationship to cardiovascular disease and disorders of carbohydrate metabolism. Eur J Clin Nutr 2007; 61(1): S100-S111.ArticlePubMedPDF
- 9. Ministry of Health and Welfare, Korea Centers for Disease Control and Prevention. Korea National Health and Nutrition Examination Survey(KNHANES IV-3). Cheongwon: Korea Centers for Disease Control and Prevention; 2008. p. 504.
- 10. Ministry of Health and Welfare, Korea Centers for Disease Control and Prevention. Korea National Health and Nutrition Examination Survey(KNHANES V-3). Cheongwon: Korea Centers for Disease Control and Prevention; 2013. p. 466-468.
- 11. Panagiotakos DB, Pitsavos C, Skoumas Y, Stefanadis C. The association between food patterns and the metabolic syndrome using principal components analysis: The ATTICA study. J Am Diet Assoc 2007; 107(6): 979-987.ArticlePubMed
- 12. Park J, Kweon SH, Kim YH, Jang MJ, Oh KW. Dietary behaviors related to metabolic syndrome in Korean adults. Korean J Community Nutr 2012; 17(5): 664-675.Article
- 13. Park MS, Suh YS, Chung YJ. Comparison of chronic disease risk by dietary carbohydrate energy ratio in Korean elderly: Using the 2007-2009 Korea National Health and Nutrition Examination Survey. J Nutr Health 2014; 47(4): 247-257.Article
- 14. Shin JY, Kim JM, Kim YR. Associations between dietary patterns and hypertension among Korean adults: the Korean National Health and Nutrition Examination Survey(2008-2010). Nutr Res Pract 2013; 7(3): 224-232.ArticlePubMedPMC
- 15. Song SJ, Lee JE, Paik HY, Park MS, Song YJ. Dietary patterns based on carbohydrate nutrition are associated with the risk for diabetes and dyslipidemia. Nutr Res Pract 2012; 6(4): 349-356.ArticlePubMedPMC
- 16. Song Y, Joung H. A traditional Korean dietary pattern and metabolic syndrome abnormalities. Nutr Metab Cardiovasc Dis 2012; 22(5): 456-462.ArticlePubMed
- 17. The Korean Nutrition Society. Dietary reference intakes for Koreans. Seoul: The Korean Nutrition Society; 2010. p. 51-53.
- 18. The Korean Nutrition Society. Dietary reference intakes for Koreans. Seoul: The Korean Nutrition Society; 2005. p. 30-31.
- 19. Wirfält E, Hedblad B, Gullberg B, Mattisson I, Andrén C, Rosander U, Janzon L, Berglund G. Food patterns and components of the metabolic syndrome in men and women: A cross-sectional study within the Malmödiet and cancer cohort. Am J Epidemiol 2001; 154(12): 1150-1159.PubMed
- 20. Yang EJ, Chung HK, Kim WY, Kerver JM, Song WO. Carbohydrate intake is associated with diet quality and risk factors for cardiovascular disease in U.S. adults: NHANES III. J Am Coll Nutr 2003; 22(1): 71-79.ArticlePubMed
REFERENCES
Table 1

General characteristics of the study subjects by the dietary carbohydrate energy ratio and the frequency of vegetable intake
Table 2

Anthropometric, blood pressure, and blood biochemical indices of the study subjects by carbohydrate energy ratio and the frequency of vegetable intake1)
1) Adjusted for sex, age, residential area, income, education level, and energy intake
2) MCLV: Moderate carbohydrate·low vegetables, MCHV: Moderate carbohydrate·high vegetables
HCLV: high carbohydrate·low vegetables, HCHV: high carbohydrate·high vegetables
3) Calculated by Complex Samples General Linear Model ANOVA
4) Mean±SE
Table 3
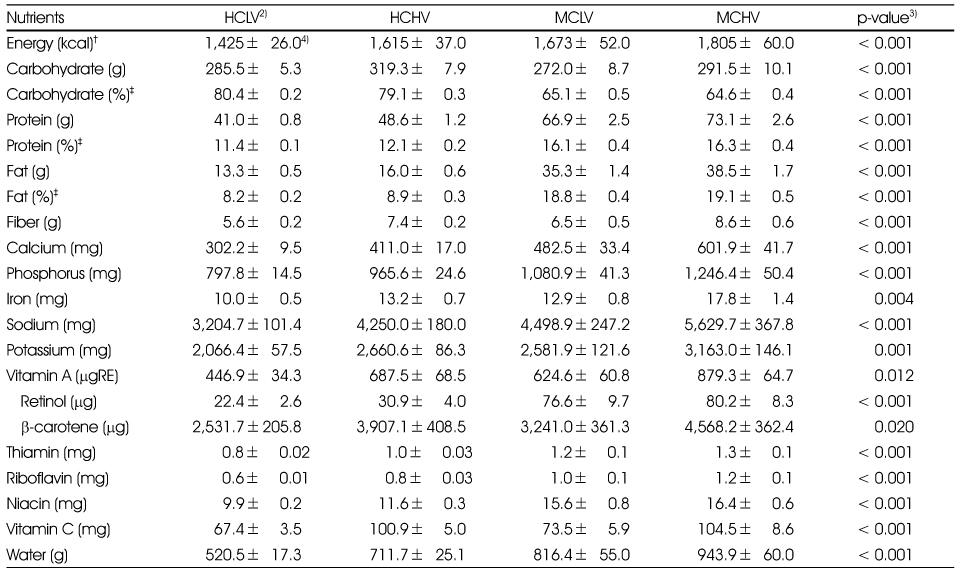
Daily energy and nutrient intakes of the study subjects by carbohydrate energy ratio and the frequency of vegetable intake1)
1) Adjusted for sex, age, residential area, income, education level, and energy intake
2) MCLV: Moderate carbohydrate·low vegetables, MCHV: Moderate carbohydrate·high vegetables
HCLV: high carbohydrate·low vegetables, HCHV: high carbohydrate·high vegetables
3) Calculated by Complex Samples General Linear Model ANOVA 4) Mean±SE
†: Adjusted not for energy intake
‡: macronutrient energy ratio
Table 4
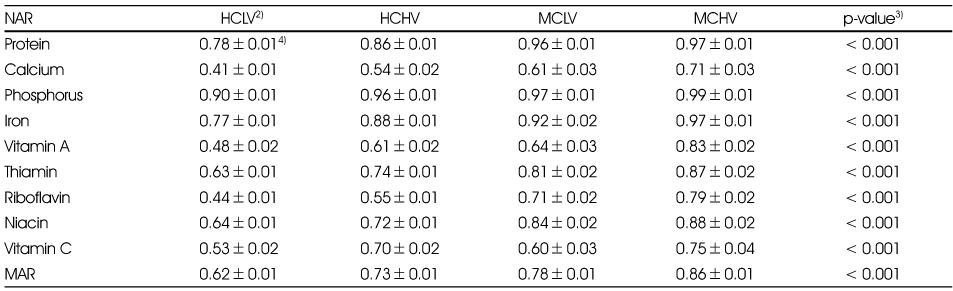
Nutrient adequacy ratio (NAR) and mean adequacy ratio (MAR) of the study subjects by the carbohydrate energy ratio and the frequency of vegetable intake1)
1) Adjusted for sex, age, residential area, income, education level, and energy intake
2) MCLV: Moderate carbohydrate·low vegetables, MCHV: Moderate carbohydrate·high vegetables
HCLV: high carbohydrate·low vegetables, HCHV: high carbohydrate·high vegetables
3) Calculated by Complex Samples General Linear Model ANOVA
4) Mean±SE
Table 5

Daily food item consumption frequency (times/day) of the study subjects by carbohydrate energy ratio and the frequency of vegetable intake1)
1) Adjusted for sex, age, residential area, income, and education level
2) MCLV: Moderate carbohydrate·low vegetables, MCHV: Moderate carbohydrate·high vegetables
HCLV: high carbohydrate·low vegetables, HCHV: high carbohydrate·high vegetables
3) Calculated by Complex Samples General Linear Model ANOVA
4) Mean±SE
Table 6

The odds ratio of chronic disease risk in the study population by carbohydrate energy ratio and the frequency of intake of vegetables1)
1) Adjusted for sex, age, residential area, income, education level, and energy intake
2) MCLV: Moderate carbohydrate·low vegetables, MCHV: Moderate carbohydrate·high vegetables
HCLV: high carbohydrate·low vegetables, HCHV: high carbohydrate·high vegetables
3) Calculated by Complex Samples Logistic Regression
4) N (%), 5) 95% confidence interval of Odds ratio, 6) Cut off point for male, 7) Cut off point for female
Figure & Data
REFERENCES
Citations
Citations to this article as recorded by 
- Association of Dietary Quality with Subjective Health-Related Perception and Chronic Diseases According to Age Segmentation of Korean Elderly
Sojeong Lee, Seungmin Lee
Korean Journal of Community Nutrition.2021; 26(5): 363. CrossRef - Energy big data acquisition and application based on service portfolio quality
Pingping Sun, Lingang Gu
Sustainable Energy Technologies and Assessments.2021; 45: 101134. CrossRef - Health and Nutrition Status of Elderly People with Multimorbidity: A Korea National Health and Nutrition Examination Survey (2013~2015)
Na-Gyeong Oh, Jung-Sook Seo
Korean Journal of Community Nutrition.2020; 25(6): 502. CrossRef - Analyzing the Relative Importance for the Development Plan of the Public Health Care System
You Ho Kim
Journal of Health Informatics and Statistics.2018; 43(4): 300. CrossRef - The Quality of a Traditional Dietary Pattern in Relation to Metabolic Syndrome in Elderly South Koreans
Chorong Oh, Jaekyung No
Journal of Obesity & Metabolic Syndrome.2018; 27(4): 254. CrossRef - Development of a Food Exchange Table and Food Pattern for Nutritionally Balanced Menu Planning
Yun Ahn, Ikhyun Yeo, Sangyun Lee, Kisun Nam
Korean Journal of Community Nutrition.2018; 23(5): 411. CrossRef - Estimation of Usual Intake and Assessment of Nutrient Intake for Korean Adolescents: Analysis of the 2010-2012 Korea National Health and Nutrition Examination Survey
Meeyoung Kim, Jihyun Yoon
Family and Environment Research.2017; 55(4): 385. CrossRef
 Cite
Cite- We recommend
- Related articles
-
- Association between nutrient intake and frailty status in Korean older adults: a cross-sectional study using the 9th (2022–2023) Korea National Health and Nutrition Examination Survey
- Comparison of dietary behaviors and nutrient intake by gender and household type among older Koreans: a cross-sectional study using data from the 8th Korea National Health and Nutrition Examination Survey
- Analysis of the relationship between sugar intake and cancer prevalence: a cross-sectional study using the 8th Korea National Health and Nutrition Examination Survey
- Biochemical characteristics, nutrient intakes, and chronic disease risk according to the dietary fat energy ratio in middle-aged Korean: a cross-sectional study using data from the 7th (2016–2018) Korean National Health and Nutrition Examination Survey
An Evaluation of Chronic Disease Risk Based on the Percentage of Energy from Carbohydrates and the Frequency of Vegetable Intake in the Korean Elderly: Using the 2007-2009 Korea National Health and Nutrition Examination Survey
An Evaluation of Chronic Disease Risk Based on the Percentage of Energy from Carbohydrates and the Frequency of Vegetable Intake in the Korean Elderly: Using the 2007-2009 Korea National Health and Nutrition Examination Survey
General characteristics of the study subjects by the dietary carbohydrate energy ratio and the frequency of vegetable intake
1) MCLV: Moderate carbohydrate·low vegetables, MCHV: Moderate carbohydrate·high vegetables
HCLV: High carbohydrate·low vegetables, HCHV: high carbohydrate·high vegetables
2) Calculated by Complex Samples χ2-test
3) N (%)
Anthropometric, blood pressure, and blood biochemical indices of the study subjects by carbohydrate energy ratio and the frequency of vegetable intake1)
1) Adjusted for sex, age, residential area, income, education level, and energy intake
2) MCLV: Moderate carbohydrate·low vegetables, MCHV: Moderate carbohydrate·high vegetables
HCLV: high carbohydrate·low vegetables, HCHV: high carbohydrate·high vegetables
3) Calculated by Complex Samples General Linear Model ANOVA
4) Mean±SE
Daily energy and nutrient intakes of the study subjects by carbohydrate energy ratio and the frequency of vegetable intake1)
1) Adjusted for sex, age, residential area, income, education level, and energy intake
2) MCLV: Moderate carbohydrate·low vegetables, MCHV: Moderate carbohydrate·high vegetables
HCLV: high carbohydrate·low vegetables, HCHV: high carbohydrate·high vegetables
3) Calculated by Complex Samples General Linear Model ANOVA 4) Mean±SE
†: Adjusted not for energy intake
‡: macronutrient energy ratio
Nutrient adequacy ratio (NAR) and mean adequacy ratio (MAR) of the study subjects by the carbohydrate energy ratio and the frequency of vegetable intake1)
1) Adjusted for sex, age, residential area, income, education level, and energy intake
2) MCLV: Moderate carbohydrate·low vegetables, MCHV: Moderate carbohydrate·high vegetables
HCLV: high carbohydrate·low vegetables, HCHV: high carbohydrate·high vegetables
3) Calculated by Complex Samples General Linear Model ANOVA
4) Mean±SE
Daily food item consumption frequency (times/day) of the study subjects by carbohydrate energy ratio and the frequency of vegetable intake1)
1) Adjusted for sex, age, residential area, income, and education level
2) MCLV: Moderate carbohydrate·low vegetables, MCHV: Moderate carbohydrate·high vegetables
HCLV: high carbohydrate·low vegetables, HCHV: high carbohydrate·high vegetables
3) Calculated by Complex Samples General Linear Model ANOVA
4) Mean±SE
The odds ratio of chronic disease risk in the study population by carbohydrate energy ratio and the frequency of intake of vegetables1)
1) Adjusted for sex, age, residential area, income, education level, and energy intake
2) MCLV: Moderate carbohydrate·low vegetables, MCHV: Moderate carbohydrate·high vegetables
HCLV: high carbohydrate·low vegetables, HCHV: high carbohydrate·high vegetables
3) Calculated by Complex Samples Logistic Regression
4) N (%), 5) 95% confidence interval of Odds ratio, 6) Cut off point for male, 7) Cut off point for female
Table 1
General characteristics of the study subjects by the dietary carbohydrate energy ratio and the frequency of vegetable intake
1) MCLV: Moderate carbohydrate·low vegetables, MCHV: Moderate carbohydrate·high vegetables HCLV: High carbohydrate·low vegetables, HCHV: high carbohydrate·high vegetables 2) Calculated by Complex Samples χ2-test 3) N (%)
Table 2
Anthropometric, blood pressure, and blood biochemical indices of the study subjects by carbohydrate energy ratio and the frequency of vegetable intake1)
1) Adjusted for sex, age, residential area, income, education level, and energy intake 2) MCLV: Moderate carbohydrate·low vegetables, MCHV: Moderate carbohydrate·high vegetables HCLV: high carbohydrate·low vegetables, HCHV: high carbohydrate·high vegetables 3) Calculated by Complex Samples General Linear Model ANOVA 4) Mean±SE
Table 3
Daily energy and nutrient intakes of the study subjects by carbohydrate energy ratio and the frequency of vegetable intake1)
1) Adjusted for sex, age, residential area, income, education level, and energy intake 2) MCLV: Moderate carbohydrate·low vegetables, MCHV: Moderate carbohydrate·high vegetables HCLV: high carbohydrate·low vegetables, HCHV: high carbohydrate·high vegetables 3) Calculated by Complex Samples General Linear Model ANOVA 4) Mean±SE †: Adjusted not for energy intake ‡: macronutrient energy ratio
Table 4
Nutrient adequacy ratio (NAR) and mean adequacy ratio (MAR) of the study subjects by the carbohydrate energy ratio and the frequency of vegetable intake1)
1) Adjusted for sex, age, residential area, income, education level, and energy intake 2) MCLV: Moderate carbohydrate·low vegetables, MCHV: Moderate carbohydrate·high vegetables HCLV: high carbohydrate·low vegetables, HCHV: high carbohydrate·high vegetables 3) Calculated by Complex Samples General Linear Model ANOVA 4) Mean±SE
Table 5
Daily food item consumption frequency (times/day) of the study subjects by carbohydrate energy ratio and the frequency of vegetable intake1)
1) Adjusted for sex, age, residential area, income, and education level 2) MCLV: Moderate carbohydrate·low vegetables, MCHV: Moderate carbohydrate·high vegetables HCLV: high carbohydrate·low vegetables, HCHV: high carbohydrate·high vegetables 3) Calculated by Complex Samples General Linear Model ANOVA 4) Mean±SE
Table 6
The odds ratio of chronic disease risk in the study population by carbohydrate energy ratio and the frequency of intake of vegetables1)
1) Adjusted for sex, age, residential area, income, education level, and energy intake 2) MCLV: Moderate carbohydrate·low vegetables, MCHV: Moderate carbohydrate·high vegetables HCLV: high carbohydrate·low vegetables, HCHV: high carbohydrate·high vegetables 3) Calculated by Complex Samples Logistic Regression 4) N (%), 5) 95% confidence interval of Odds ratio, 6) Cut off point for male, 7) Cut off point for female


