
Articles
- Page Path
- HOME > Korean J Community Nutr > Volume 16(3); 2011 > Article
-
Original Article
- Changes in Food and Nutrient Intakes of College Students between 1999 and 2009
- Han Byul Jang, Hwa Young Lee, Young-Hee Han, Jeehye Song, Ki Nam Kim, Taisun Hyun
-
Korean Journal of Community Nutrition 2011;16(3):324-336.
DOI: https://doi.org/10.5720/kjcn.2011.16.3.324
Published online: June 30, 2011
Department of Food and Nutrition, Chungbuk National University, Cheongju, Korea.
- Corresponding author: Taisun Hyun, Department of Food and Nutrition, Chungbuk National University, Cheongju 361-763, Korea. Tel:(043) 261-2790, Fax:(043) 267-2742, taisun@chungbuk.ac.kr
• Received: May 25, 2011 • Revised: June 7, 2011 • Accepted: June 22, 2011
Copyright © 2011 The Korean Society of Community Nutrition
- 1,914 Views
- 1 Download
- 21 Crossref


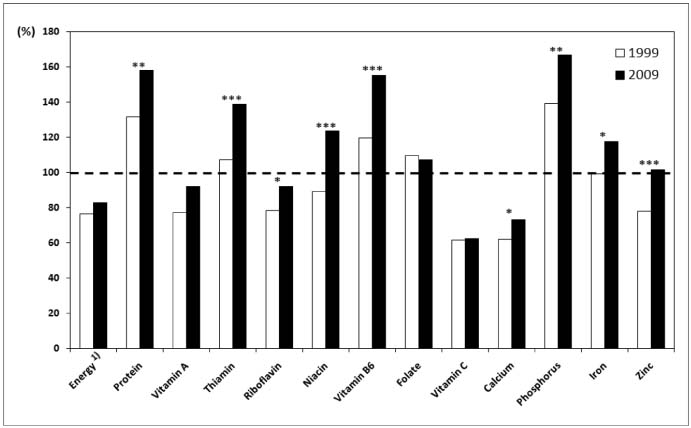
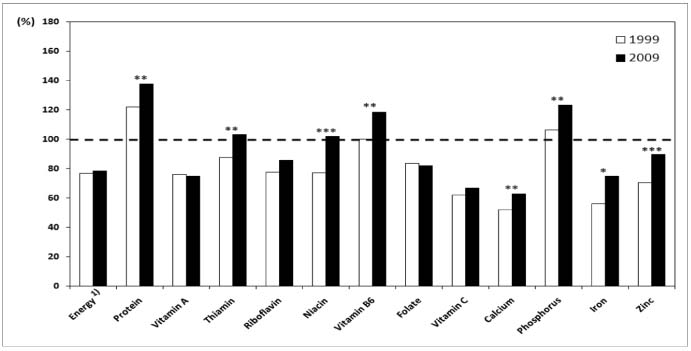

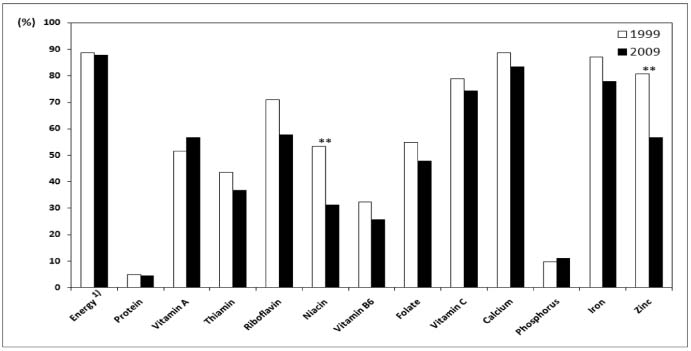
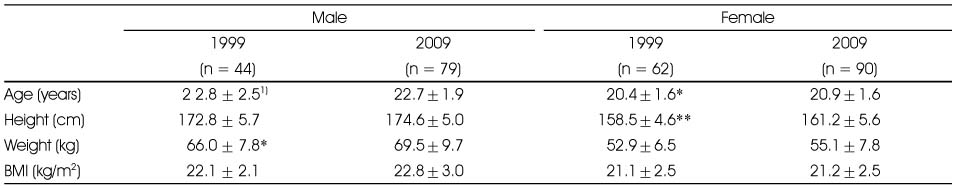
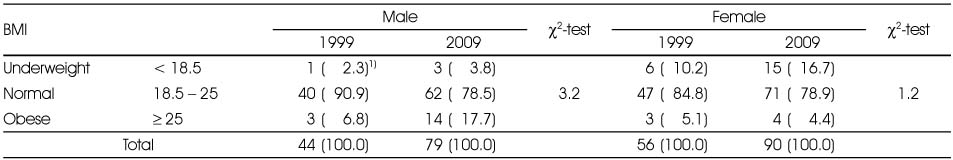
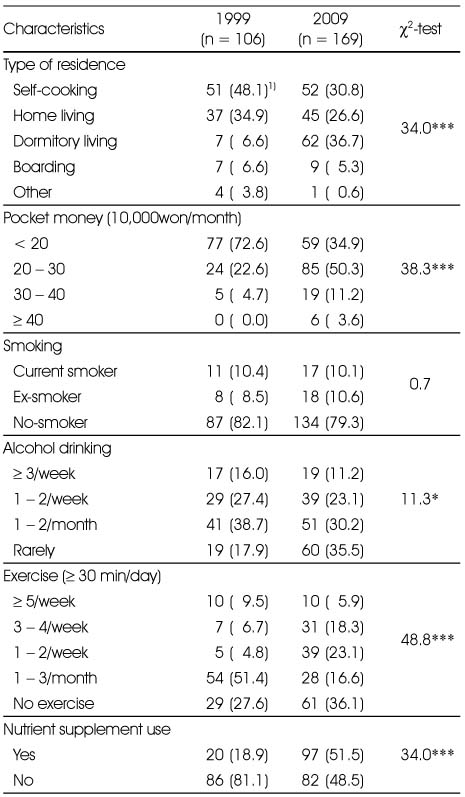
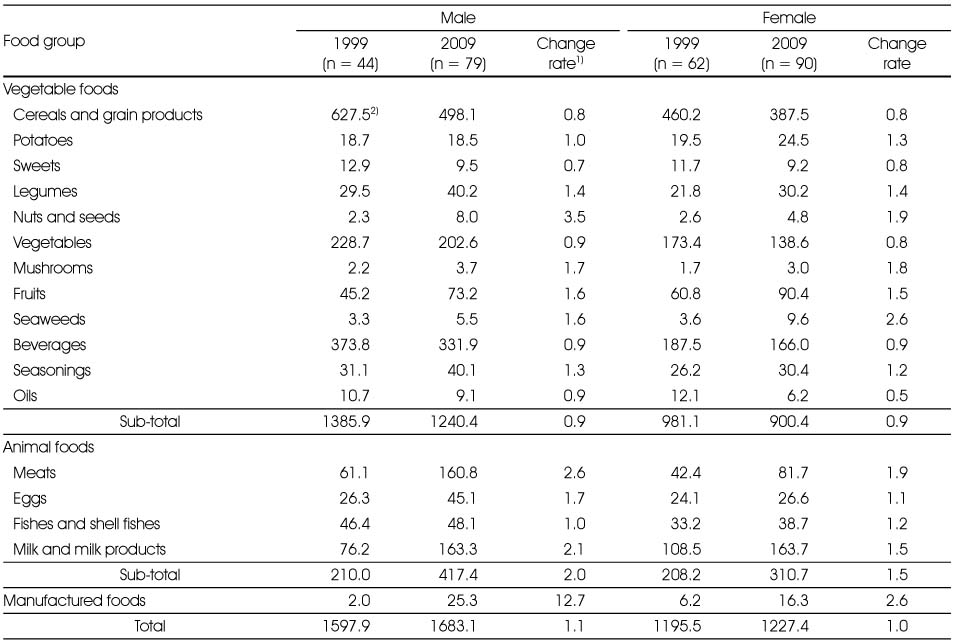
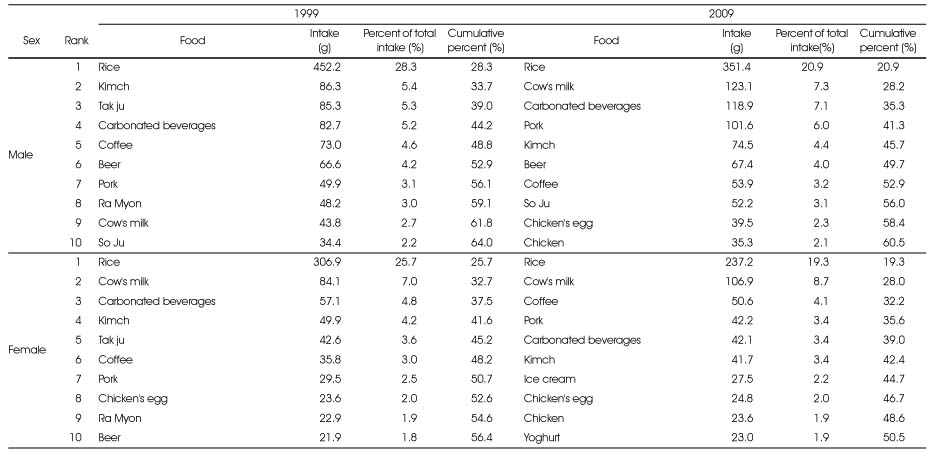
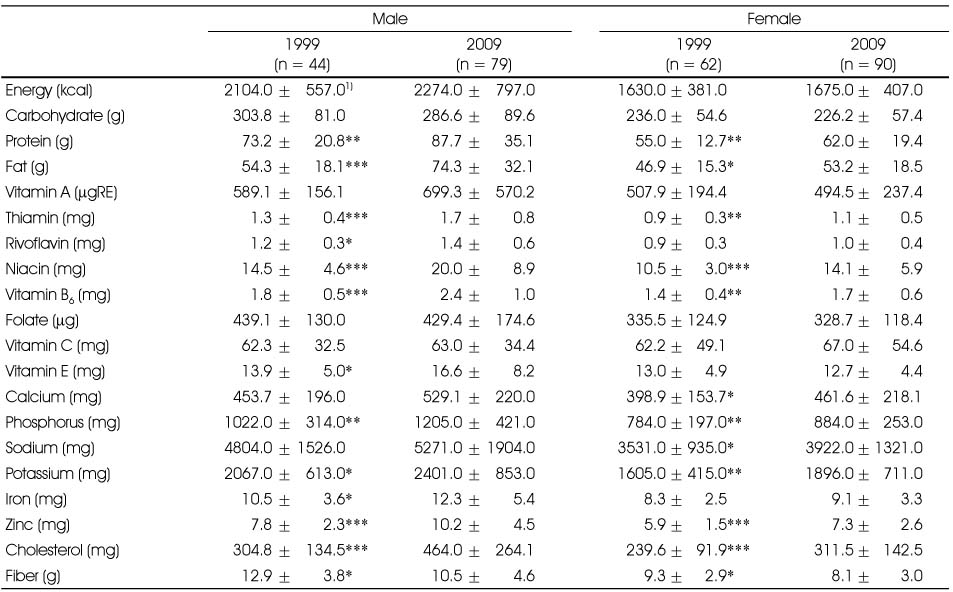
Figure & Data
REFERENCES
Citations
Citations to this article as recorded by 
- Dietary zinc intake and sources among Koreans: findings from the Korea National Health and Nutrition Examination Survey 2016–2019
Jee-Seon Shim, Ki Nam Kim, Jung-Sug Lee, Mi Ock Yoon, Hyun Sook Lee
Nutrition Research and Practice.2023; 17(2): 257. CrossRef - Nutritional Assessment Focusing on Minerals of Ready-to-Cook Foods Sold in Korea
Eun-Sun Park, Mi-Hyun Kim, Mi-Kyeong Choi
Journal of the East Asian Society of Dietary Life.2019; 29(6): 501. CrossRef - Trends in energy intake among Korean adults, 1998-2015: Results from the Korea National Health and Nutrition Examination Survey
Sungha Yun, Hyun Ja Kim, Kyungwon Oh
Nutrition Research and Practice.2017; 11(2): 147. CrossRef - University Students’ Eating Habit, Perception and Acceptance of Korean Food in Jeollabuk-do Province
Kyung Jin Min, Hwi-Jin Joung, Ye-Ji Lee, Moon Sook Kim, Il Sook Choi
Korean Journal of Food & Cookery Science.2017; 33(5): 588. CrossRef - Recognition and Consumption of Meal Alone and Processed Food according to Major of College Students
Byung Bum Choi
The Korean Journal of Food And Nutrition.2016; 29(6): 911. CrossRef - Perception on Optimal Diet, Diet Problems and Factors Related to Optimal Diet Among Young Adult Women Using Focus Group Interviews: Based on Social Cognitive Theory
Hye Jin Kim, A Reum Lee, Kyung Won Kim
Korean Journal of Community Nutrition.2016; 21(4): 332. CrossRef - A Comparative Analysis of Salt-Related Dietary Patterns According to the Sodium Intake of College Students in Busan
Sang Hee Lee, Ho Kyung Ryu
The Korean Journal of Community Living Science.2015; 26(1): 167. CrossRef - Comparison of Dietary Self-efficacy, Obesity Stress, and Obesity-related Quality of Life According to BMI and Stages of Change in Vegetable Consumption for Nursing Students
Myoung Sook Kim
The Journal of Korean Academic Society of Nursing Education.2015; 21(1): 65. CrossRef - The Study of Nutrient Intakes, Blood Lipids and Bone Density According to Obesity Degree Among University Students in Jeonbuk
Hye-Soon Chang
Korean Journal of Human Ecology.2014; 23(4): 743. CrossRef - A Study on the Health Status, and Nutrient Intakes according to Body Mass Index (BMI) of College Men in Seoul Area
Kyung Ok Shin, Kyung Soon Choi
The Korean Journal of Food And Nutrition.2014; 27(3): 507. CrossRef - Comparison of dietary habits, perception and consumption frequency of fast foods between youths working part-time at fast food restaurants and other food-related services
Mi Yang Jo, Taisun Hyun
Journal of Nutrition and Health.2014; 47(3): 206. CrossRef - Salt-related Dietary Behaviors of University Students in Gyeongbuk Area
Kyung-A Lee
Journal of the Korean Society of Food Science and Nutrition.2014; 43(7): 1122. CrossRef - Consumption of health functional food and dietary habits, nutrient intake and dietary quality of college students in Incheon
So Young Kim, Jeong Soon You, Kyung Ja Chang
Korean Journal of Nutrition.2013; 46(2): 166. CrossRef - The study of Perception in Body Somatotype and Dietary Behaviors - The Comparative Study between Korean and Chinese College Students -
Youngmee Lee, Lin Sun
Korean Journal of Community Nutrition.2013; 18(1): 25. CrossRef - Intake and blood concentrations of folate and their association with health-related behaviors in Korean college students
Han-Byul Jang, Young-Hee Han, Chandrika J Piyathilake, Heon Kim, Taisun Hyun
Nutrition Research and Practice.2013; 7(3): 216. CrossRef - Comparison of the lipids levels, C-reactive protein and adiponectin in adolescent male by fat intake
Sung-Hye Lee, Mi-Young Park, Soon-Kyung Kim, Young-Ki Min
Korean Journal of Nutrition.2012; 45(4): 303. CrossRef - Beliefs Regarding Vegetable Consumption, Self-Efficacy and Eating Behaviors according to the Stages of Change in Vegetable Consumption among College Students
Yun Ahn, Kyung Won Kim
Korean Journal of Community Nutrition.2012; 17(1): 1. CrossRef - Comparison of the lipids levels, C-reactive protein and adiponectin in adolescent male by fat intake
Sung-Hye Lee, Mi-Young Park, Soon-Kyung Kim, Young-Ki Min
Korean Journal of Nutrition.2012; 45(4): 303. CrossRef - Comparison of Eating Behavior between Commensality and Solo-eating of University Students by BMI
Youngmee Lee, Wookyoun Cho, Yujin Oh
Korean Journal of Community Nutrition.2012; 17(3): 280. CrossRef - How do the work environment and work safety differ between the dry and wet kitchen foodservice facilities?
Hye-Ja Chang, Jeong-Won Kim, Se-Young Ju, Eun-Sun Go
Nutrition Research and Practice.2012; 6(4): 366. CrossRef - Survey on Consumption of Coffee Beverages and Energy Contribution Ratios of Coffee Beverages and Accompanying Snacks by College Students in Daejeon City and Chungnam Province in Korea
Young-Hee Lim, Sun-Hyo Kim
Journal of the Korean Society of Food Culture.2012; 27(3): 240. CrossRef
 Cite
CiteChanges in Food and Nutrient Intakes of College Students between 1999 and 2009
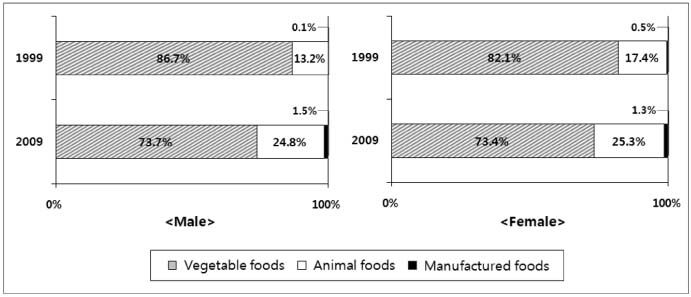
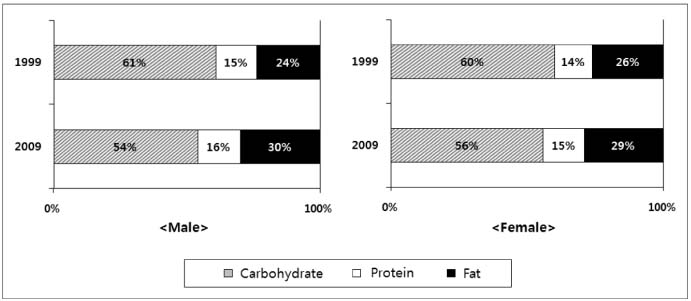


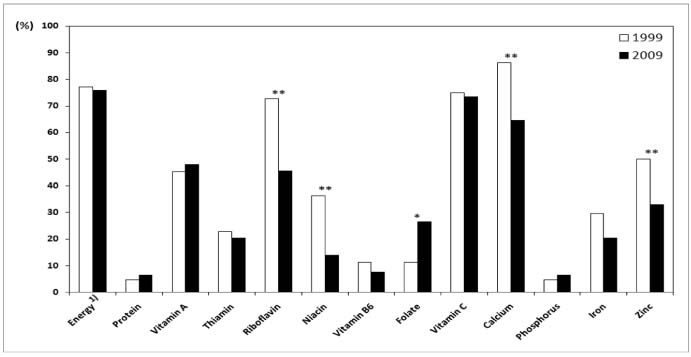

Fig. 1
Comparison of food source consumed by the subjects
Fig. 2
Percentages of energy from carbohydrate, protein, and fat.
Fig. 3
Nutrient intakes of male students as percentages of Recommend Intakes.
1) Energy intake was compared with Estimated Energy Requirement.
*: p < 0.05, **: p < 0.01, ***: p < 0.001 Significantly different between 1999 and 2009 by t-test
Fig. 4
Nutrient intakes of female students as percentage of Recommend Intakes.
1) Energy intake was compared with Estimated Energy Requirement
*: p < 0.05, **: p < 0.01, ***: p < 0.001 Significantly different between 1999 and 2009 by t-test
Fig. 5
Percentages of male students whose intake of selected nutrient was less than Estimated Average Requirement.
1) Estimated Energy Requirement was used for energy
*: p < 0.05, **: p < 0.01: Significantly different by χ2-test
Fig. 6
Percentages of female students whose intake of selected nutrient was less than Estimated Average Requirement.
1) Estimated Energy Requirement was used for energy
**: p < 0.01: Significantly different by χ2-test
Fig. 1
Fig. 2
Fig. 3
Fig. 4
Fig. 5
Fig. 6
Changes in Food and Nutrient Intakes of College Students between 1999 and 2009
Age and anthropometric data of the subjects
1) Mean±SD
*: p < 0.05, **: p < 0.01 Significantly different from the data in 2009 by t-test
Body mass index (BMI) distribution of the subjects
1) N (%)
General characteristics of the subjects
1) N (%)
*: p < 0.05, ***: p < 0.001 Significantly different by χ2-test
Mean intakes of food groups
1) Change rate = intake in 2009/intake in 1999
2) unit: g
Top 10 most consumed foods in 1999 and 2009
Mean daily nutrient intakes of the subjects
1) Mean ± SD
*: p < 0.05, **: p < 0.01, ***: p < 0.001: Significantly different from the intakes in 2009 by t-test
Table 1
Age and anthropometric data of the subjects
1) Mean±SD *: p < 0.05, **: p < 0.01 Significantly different from the data in 2009 by t-test
Table 2
Body mass index (BMI) distribution of the subjects
1) N (%)
Table 3
General characteristics of the subjects
1) N (%) *: p < 0.05, ***: p < 0.001 Significantly different by χ2-test
Table 4
Mean intakes of food groups
1) Change rate = intake in 2009/intake in 1999 2) unit: g
Table 5
Top 10 most consumed foods in 1999 and 2009
Table 6
Mean daily nutrient intakes of the subjects
1) Mean ± SD *: p < 0.05, **: p < 0.01, ***: p < 0.001: Significantly different from the intakes in 2009 by t-test


