
Articles
- Page Path
- HOME > Korean J Community Nutr > Volume 24(4); 2019 > Article
-
Research Article
- Comparison Analysis of Dietary Behavior and Nutrient Intakes of the Elderly according to Their Family Status: The Korea National Health and Nutrition Examination Survey 2013–2016
-
Ji-Hong Oh
 , Bok-Mi Jung
 -
Korean Journal of Community Nutrition 2019;24(4):309-320.
DOI: https://doi.org/10.5720/kjcn.2019.24.4.309
Published online: August 31, 2019
1Major in Nutrition Education, Graduate School of Education, Chonnam National University, Gwangju 61186, Korea, Student.
2Division of Food and Nutrition, Chonnam National University, Research Institute for Human Ecology, Gwangju 61186, Korea, Professor.
- Corresponding author: Bok-Mi Jung. Division of Food and Nutrition, Chonnam National University, Gwangju 61186, Korea. Tel: (062) 530-1353, Fax: (062) 530-1339, jbm@jnu.ac.kr
• Received: June 28, 2019 • Revised: August 20, 2019 • Accepted: August 20, 2019
Copyright © 2019 The Korean Society of Community Nutrition
This is an Open-Access article distributed under the terms of the Creative Commons Attribution Non-Commercial License (http://creativecommons.org/licenses/by-nc/3.0/) which permits unrestricted non-commercial use, distribution, and reproduction in any medium, provided the original work is properly cited.
- 2,224 Views
- 23 Download
- 13 Crossref
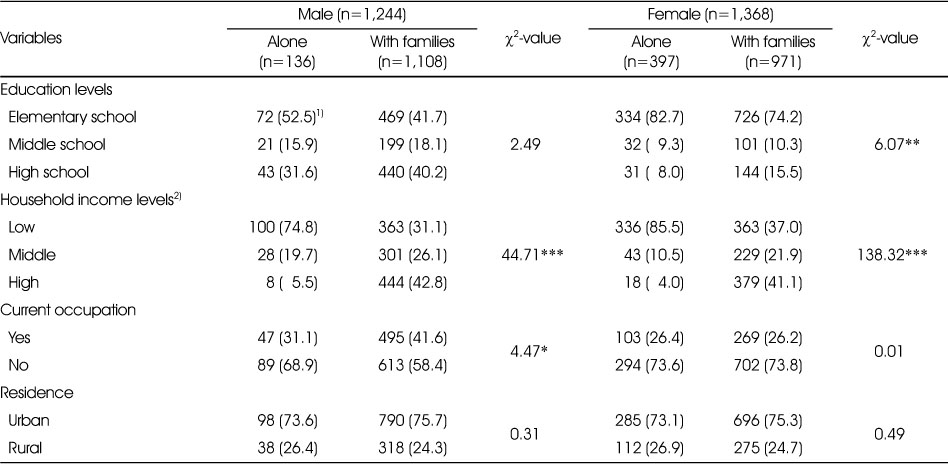
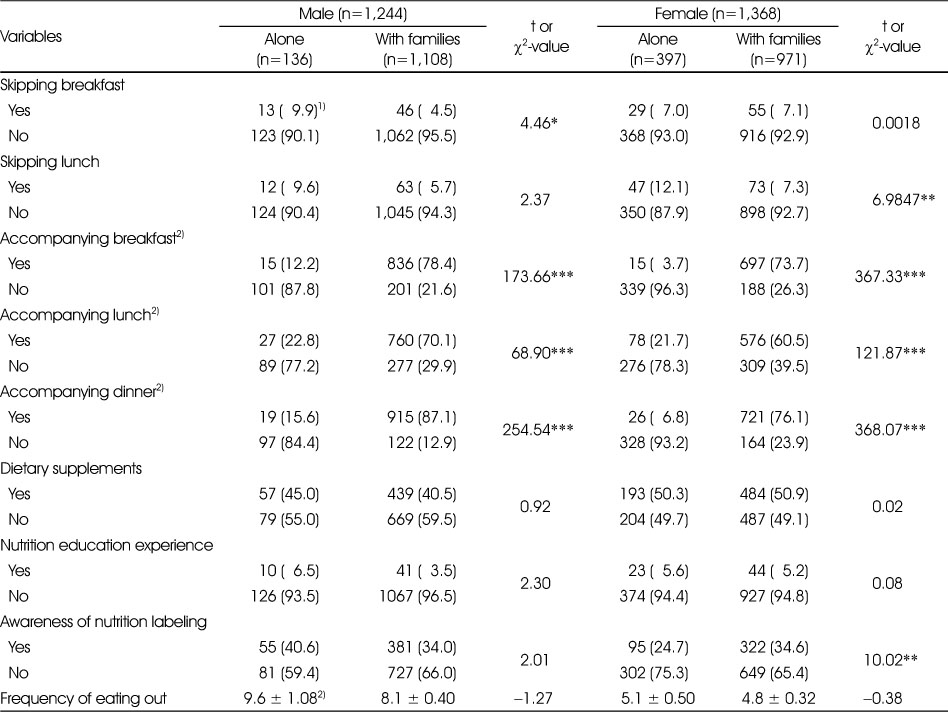
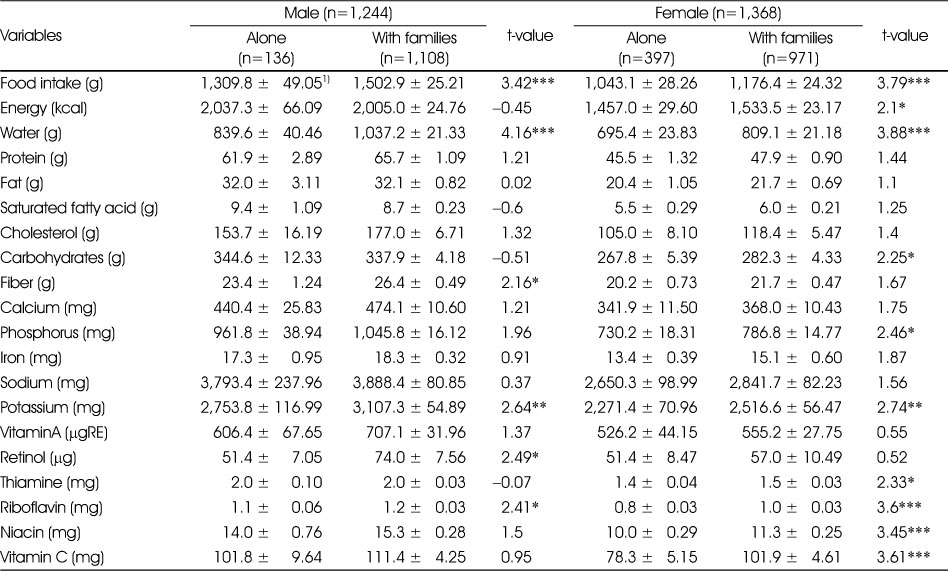
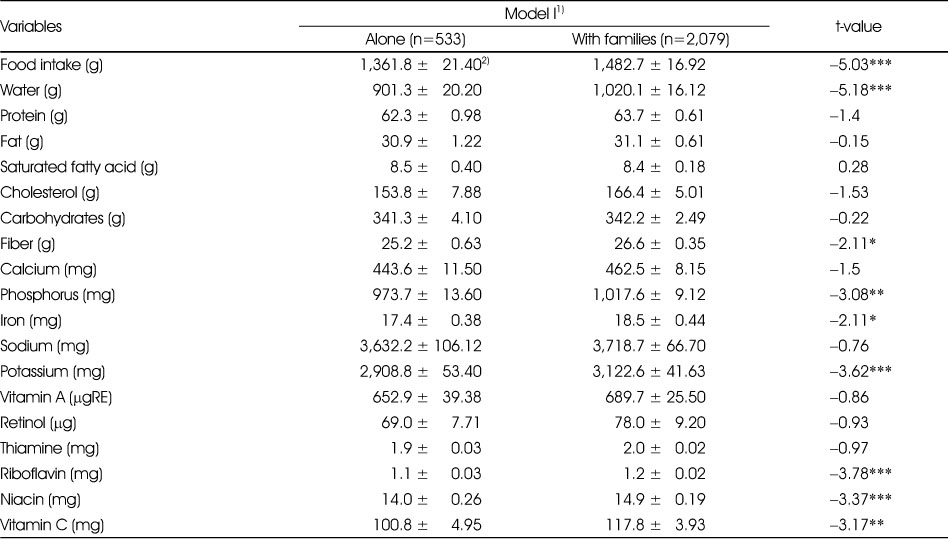
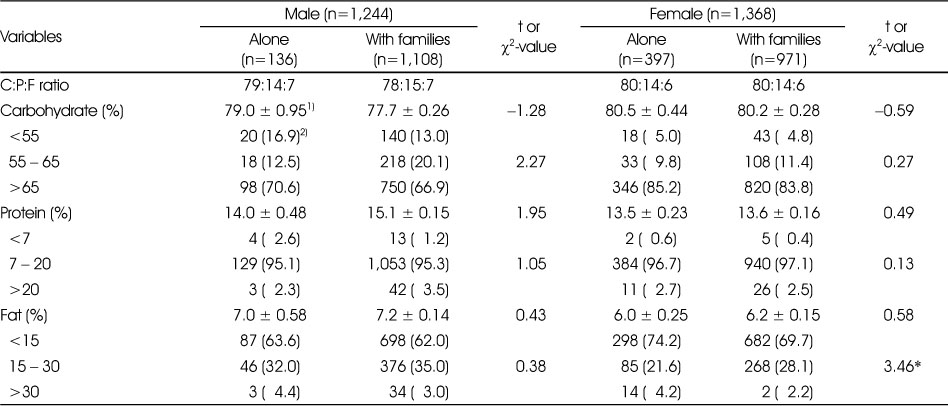
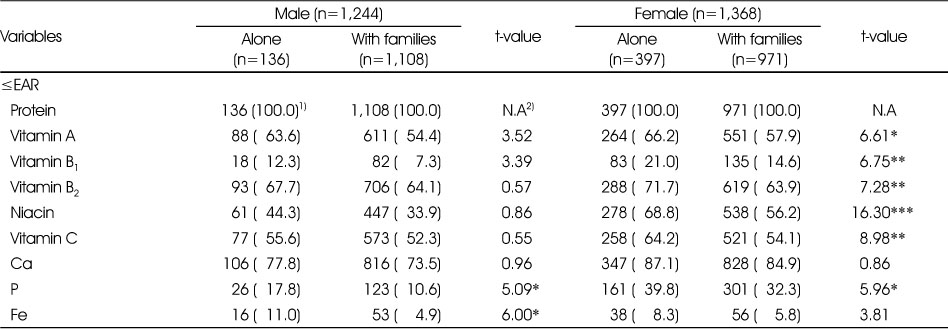
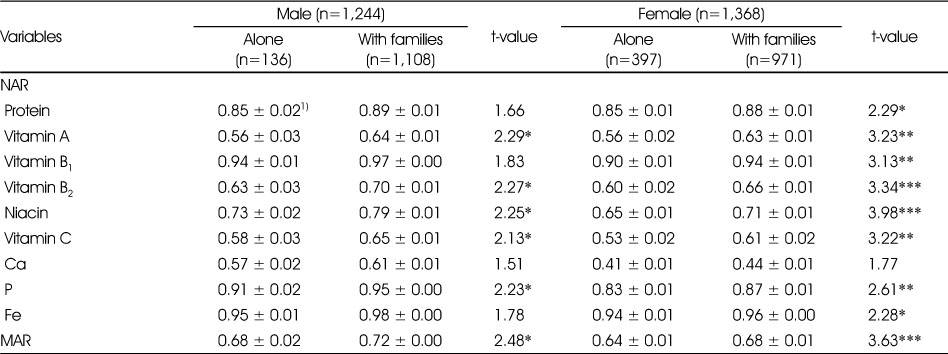
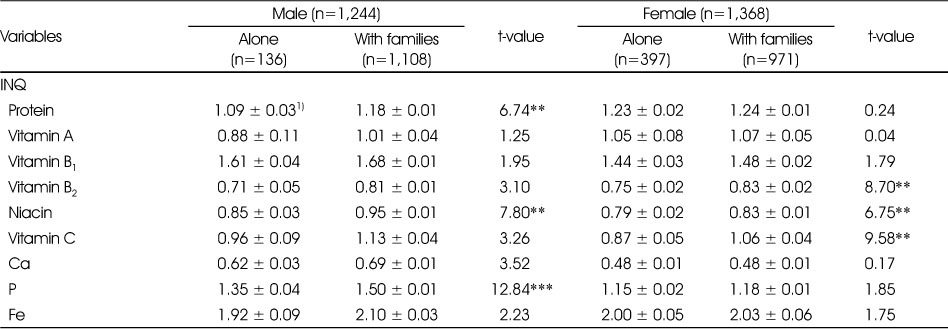
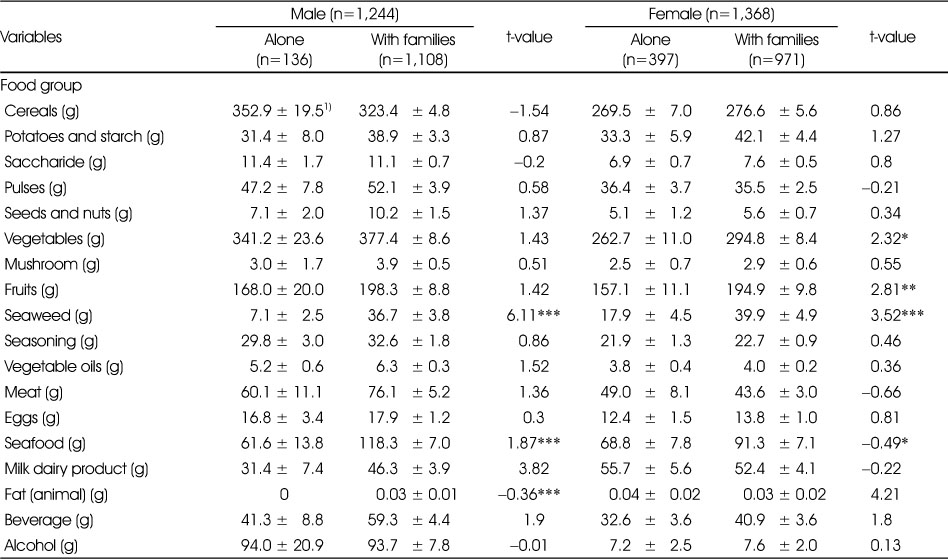
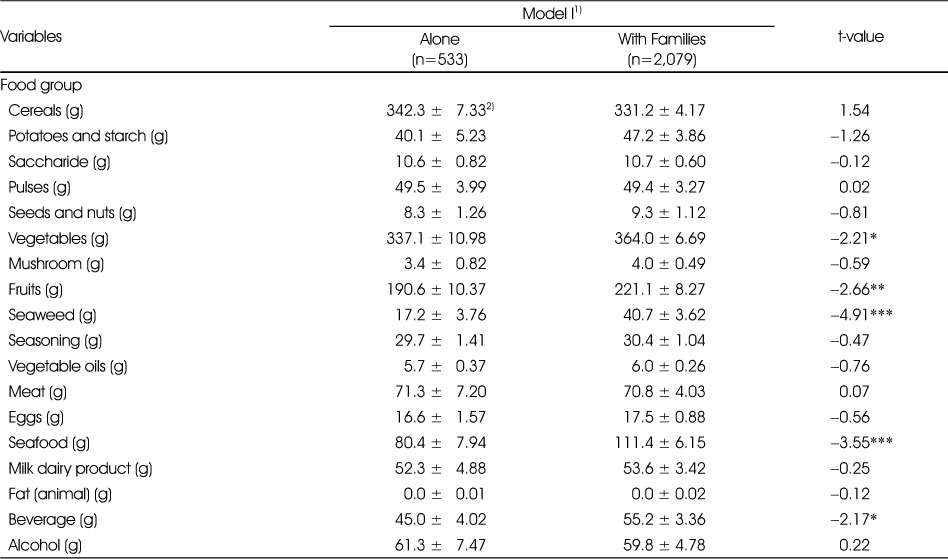
Figure & Data
REFERENCES
Citations
Citations to this article as recorded by 
- Comparison of dietary behaviors and nutrient intake by gender and household type among older Koreans: a cross-sectional study using data from the 8th Korea National Health and Nutrition Examination Survey
Dana Park, Soo-Kyung Lee
Korean Journal of Community Nutrition.2026; 31(1): 87. CrossRef - Nutritional vulnerability and its associated characteristics among the elderly in Seoul: analysis of data from the Seoul food survey 2024
Misung Lee, Youngmin Nam, Hye-Jong Yoo, Jihyun Yoon
Frontiers in Nutrition.2026;[Epub] CrossRef - A comparative study on nutritional status and diet-related subjective perceptions according to free meal service utilization among older adults living alone in Korea: a cross-sectional study
Minju Jeong, Dayeon Shin
Korean Journal of Community Nutrition.2026; 31(2): 165. CrossRef - Food insecurity and its associated characteristics of the elderly in Seoul: analysis of the data from the Seoul Food Survey 2023
Hyunjeong Park, Youngmin Nam, Linxi Huang, Youngmi Lee, Jihyun Yoon
Nutrition Research and Practice.2025; 19(1): 117. CrossRef - 노인의 사회활동 참여 정도와 영양상태와의 관계
지수 백, 영란 허
Korean Journal of Food and Cookery Science.2025; 41(6): 418. CrossRef - Profiling the socioeconomic characteristics, dietary intake, and health status of Korean older adults for nutrition plan customization: a comparison of principal component, factor, and cluster analyses
Kyungsook Woo, Kirang Kim
Epidemiology and Health.2024; 46: e2024043. CrossRef - Evaluation on the Nutrition Quotient Scores of Elderly People Living Alone in Korea
Gyoungok Gang, Min Lee, Eun-hui Choi, Hye-Lim Lee, Hyun-Young Lee, Hye-Ja Chang, Jung-Hwa Choi, Na-Young Yi, Kyung-Eun Lee, Min-Jae Chung, Tong-Kyung Kwak
Nutrients.2023; 15(17): 3750. CrossRef - Changes in nutritional status of Korean older adults during COVID-19 Pandemic by household income and demographic factors-using the Korea National Health and Nutrition Examination Survey(2019-2020): a cross-sectional study
You-Sin Lee, Yoonna Lee
Korean Journal of Community Nutrition.2023; 28(4): 302. CrossRef - Comparison of the Nutrient Intake and Health Status of Elderly Koreans According to their BMI Status: Focus on the Underweight Elderly Population
You-Sin Lee, Yoonna Lee
Korean Journal of Community Nutrition.2022; 27(5): 422. CrossRef - Comparison of the health and nutritional status of Korean elderly considering the household income level, using the 2018 Korea National Health and Nutrition Examination Survey
Jin Mo Khil
Journal of Nutrition and Health.2021; 54(1): 39. CrossRef - Social participation, health‐related behavior, and depression of older adults living alone in Korea
Seojin Won, Hyemee Kim
Asian Social Work and Policy Review.2020; 14(1): 61. CrossRef - Evaluation of the dietary quality and nutritional status of elderly people using the Nutrition Quotient for Elderly (NQ-E) in Seoul
Sun-Wook Ham, Kyung-Hee Kim
Journal of Nutrition and Health.2020; 53(1): 68. CrossRef - Health and Nutrition Status of Elderly People with Multimorbidity: A Korea National Health and Nutrition Examination Survey (2013~2015)
Na-Gyeong Oh, Jung-Sook Seo
Korean Journal of Community Nutrition.2020; 25(6): 502. CrossRef
 Cite
Cite- We recommend
- Related articles
-
- Comparison of dietary behaviors and nutrient intake by gender and household type among older Koreans: a cross-sectional study using data from the 8th Korea National Health and Nutrition Examination Survey
- Ultra-processed food intake and dietary behaviors in Korean adolescents: a cross-sectional study based on the 2019–2023 Korea National Health and Nutrition Examination Survey
- Self-reported weight change and diet quality in relation to metabolic syndrome among Korean cancer survivors: a cross-sectional study using the Korea National Health and Nutrition Examination Survey 2019–2021
- Analysis of the relationship between sugar intake and cancer prevalence: a cross-sectional study using the 8th Korea National Health and Nutrition Examination Survey
- Trends in growth and nutritional status of Korean toddlers and preschoolers: a cross-sectional study using 2010–2021 Korea National Health and Nutrition Examination Survey data
Comparison Analysis of Dietary Behavior and Nutrient Intakes of the Elderly according to Their Family Status: The Korea National Health and Nutrition Examination Survey 2013–2016
Comparison Analysis of Dietary Behavior and Nutrient Intakes of the Elderly according to Their Family Status: The Korea National Health and Nutrition Examination Survey 2013–2016
General characteristics of the elderly living alone and the elderly living with their families
1) n (%)
2) Household income levels: ‘Low’=less than 100, ‘Middle’=101~200, ‘High’=exceed 200
*: p<0.05, **: p<0.01, ***: p<0.001
Dietary habits of the elderly living alone and the elderly living with their families
1) n (%)
2) Exclude: not applicable (meal frequency less than two times a week)
*: p<0.05, **: p<0.01, ***: p<0.001
Daily energy and nutrient intakes of the elderly living alone and the elderly living with their families
1) Mean ± S.E.
*: p<0.05, **: p<0.01, ***: p<0.001
Daily energy and nutrient intakes per 1,000 Kcal by households type
1) Model I: adjusted nutrient intake per 1,000 kcal
2) Mean ± S.E.
*: p<0.05
Energy nutrients and CPF ratio of the elderly living alone and the elderly living with their families
1) Mean ± S.E.
2) n (%)
*: p<0.05
Estimated average requirement (EAR) of the elderly living alone and the elderly living with their families
1) n (%)
2) not applicable
*: p<0.05, **: p<0.01, ***: p<0.001
Nutrient adequacy ratio(NAR) and mean adequacy ratio(MAR) of the elderly living alone and the elderly living with their families
1) Mean ± S.E.
*: p<0.05, **: p<0.01, ***: p<0.001
Index of nutrient quality (INQ) of the elderly living alone and the elderly living with their families
1) Mean ± S.E.
**: p<0.01, ***: p<0.001
Food consumption estimated by 24-hour recall of the elderly living alone and the elderly living with their families
1) Mean ± S.E.
*: p<0.05, **: p<0.01, ***: p<0.001
Food consumption estimated by 24-hour recall per 1,000 Kcal by households type
1) adjusted food consumption per 1,000 kcal
2) Mean ± S.E.
*: p<0.05, **: p<0.01, ***: p<0.001
Table 1
General characteristics of the elderly living alone and the elderly living with their families
1) n (%) 2) Household income levels: ‘Low’=less than 100, ‘Middle’=101~200, ‘High’=exceed 200 *: p<0.05, **: p<0.01, ***: p<0.001
Table 2
Dietary habits of the elderly living alone and the elderly living with their families
1) n (%) 2) Exclude: not applicable (meal frequency less than two times a week) *: p<0.05, **: p<0.01, ***: p<0.001
Table 3
Daily energy and nutrient intakes of the elderly living alone and the elderly living with their families
1) Mean ± S.E. *: p<0.05, **: p<0.01, ***: p<0.001
Table 4
Daily energy and nutrient intakes per 1,000 Kcal by households type
1) Model I: adjusted nutrient intake per 1,000 kcal 2) Mean ± S.E. *: p<0.05
Table 5
Energy nutrients and CPF ratio of the elderly living alone and the elderly living with their families
1) Mean ± S.E. 2) n (%) *: p<0.05
Table 6
Estimated average requirement (EAR) of the elderly living alone and the elderly living with their families
1) n (%) 2) not applicable *: p<0.05, **: p<0.01, ***: p<0.001
Table 7
Nutrient adequacy ratio(NAR) and mean adequacy ratio(MAR) of the elderly living alone and the elderly living with their families
1) Mean ± S.E. *: p<0.05, **: p<0.01, ***: p<0.001
Table 8
Index of nutrient quality (INQ) of the elderly living alone and the elderly living with their families
1) Mean ± S.E. **: p<0.01, ***: p<0.001
Table 9
Food consumption estimated by 24-hour recall of the elderly living alone and the elderly living with their families
1) Mean ± S.E. *: p<0.05, **: p<0.01, ***: p<0.001
Table 10
Food consumption estimated by 24-hour recall per 1,000 Kcal by households type
1) adjusted food consumption per 1,000 kcal 2) Mean ± S.E. *: p<0.05, **: p<0.01, ***: p<0.001


