Articles
- Page Path
- HOME > Korean J Community Nutr > Volume 18(3); 2013 > Article
-
Original Article
- Effectiveness of Center for Child-Care Foodservice Management for Menu Management and Dietary Variety
- Hye-Young Kim, Il-Sun Yang, In-Sook Chae, Bo-Sook Yi, Moon-Kyung Park, Ha-Young Kim, Tae-Seok Kang, Dong-Gil Leem, Jin-Ha Lee, Hae-Young Lee
-
Korean Journal of Community Nutrition 2013;18(3):243-256.
DOI: https://doi.org/10.5720/kjcn.2013.18.3.243
Published online: June 30, 2013
Institute of Symbiotic Life-TECH, Yonsei University, Seoul, Korea.
1Deptartment of Food and Nutrition, Yonsei University, Seoul, Korea.
2Department of Food Science and Nutrition, Jeju National University, Jeju, Korea.
3Deptartment of Food and Nutrition, Hanyang Women's University, Seoul, Korea.
4Nutrition and Functional Food Research, National Institute of Food and Drug Safety Evaluation, Cheongwon, Korea.
5Department of Food and Nutrition, Sangji University, Wonju, Korea.
- Corresponding author: Hae-Young Lee, Department of Food and Nutrition, Sangji University, 660 Woosan-dong, Wonju 220-702, Korea. Tel: (033) 730-0492, Fax: (033) 738-7740, hy1317@sangji.ac.kr
Copyright © 2013 The Korean Society of Community Nutrition
This is an Open-Access article distributed under the terms of the Creative Commons Attribution Non-Commercial License (http://creativecommons.org/licenses/by-nc/3.0/) which permits unrestricted non-commercial use, distribution, and reproduction in any medium, provided the original work is properly cited.
- 1,400 Views
- 2 Download
- 10 Crossref
Figure & Data
REFERENCES
Citations

- A Study of Food Safety Knowledge for Sustainable Foodservice Management of Childcare Centers in South Korea Using Importance–Performance Analysis
Jeong-Sil Choi, Se-Young Ju
International Journal of Environmental Research and Public Health.2022; 19(15): 9668. CrossRef - The Effect of Personality Type and Job Performance on Emotional Exhaustion and Job Satisfaction - Staff of the Center for Children's foodservice management -
Kyung-Min Lee, Min-Sun Jeon
Korean Journal of Community Nutrition.2018; 23(6): 496. CrossRef - Assessment of the Effectiveness and Perception of Education by Center for Child-Care Foodservice Management: Focus on Parents of Child-Care and Kindergarten in Seoul
Se-Young Ju, Wan-Soo Hong
Korean Journal of Food and Cookery Science.2018; 34(4): 404. CrossRef - Analysis of Sanitary Safety Management Improvement for Children’s Food service in Chilgok-gun Area
Suk-Hyeon Park, Hyeon-A Jung
Journal of the East Asian Society of Dietary Life.2018; 28(5): 345. CrossRef - Comparison of nutrients and food intakes of young children according to lunch places: based on the fifth Korea National Health and Nutrition Examination Survey
Young-Sun Choi
Journal of Nutrition and Health.2018; 51(3): 254. CrossRef - Center for Children's Foodservice Management (CCFSM) Employees' Perception of Difficulties in Performing Tasks
Eun Hye Park, Young Eun Lee
Journal of the Korean Society of Food Science and Nutrition.2015; 44(4): 619. CrossRef - The Assessment of Food Safety Practices and the Effect of Visiting Education on Food Safety Improvement in Children's Foodservice Facilities
Jae-Eun Paik, Hyun-A Lee, Hyun-Joo Bae
Korean journal of food and cookery science.2015; 31(6): 764. CrossRef - Satisfaction with Children's Foodservice Facilities about Program at Center for Children’s Foodservice Management in Seoul: Difference between Associate Members and Regular Members
Yoon-Jae Yoon, Sooyoun Kwon, Serin Go, Jiyoon Kim
Journal of the East Asian Society of Dietary Life.2015; 25(4): 703. CrossRef - Effects of an Education Program on Sanitation Status at Centers for Children's Food Service Management: Focusing on Jung-gu and Dong-gu regions of Daejeon Metropolitan City
Yu-Jin Seo, Min-Sun Jeon
Korean Journal of Community Nutrition.2015; 20(6): 447. CrossRef - Task Satisfaction, Job Satisfaction, Organizational Commitment, and Turnover Intension of Center for Children's Foodservice Management Employees
Eun Hye Park, Young Eun Lee
Journal of the Korean Society of Food Science and Nutrition.2015; 44(12): 1881. CrossRef
General characteristics of the child-care centers & kindergartens
1) N (%), 2) χ2-value, 3) Mean ± SD, 4) The multiple responses
*: p < 0.05, **: p < 0.01, ***: p < 0.001
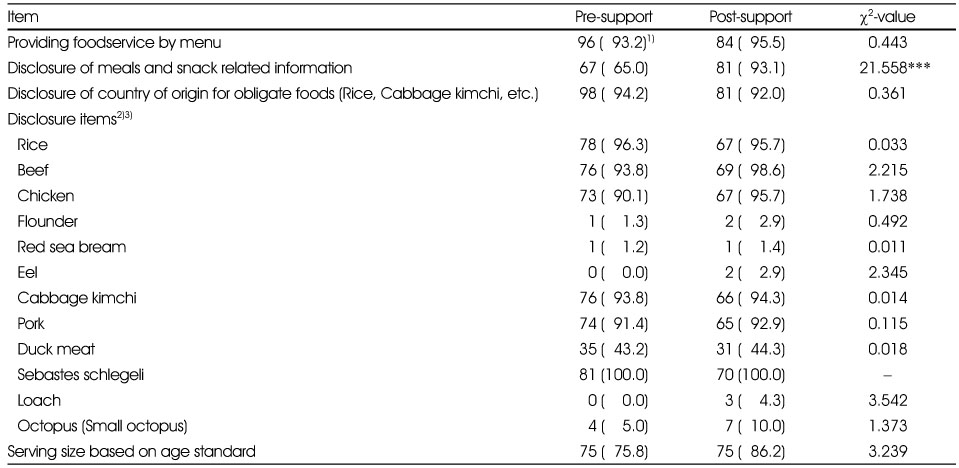
Comparison of the menu planning between pre-support and post-support by CCFSM
1) Frequency (%)
2) For respondents that say yes to the above question
3) The multiple responses
**: p < 0.01, ***: p < 0.001
Comparison of the menu operating between pre-support and post-support by CCFSM
1) Frequency (%)
2) For respondents that say yes to the above question
3) The multiple responses
***: p < 0.001
Comparison of the nutritional needs between pre-support and post-support by CCFSM
1) Frequency (%)
2) For respondents that say yes to the above question
3) The multiple responses
*: p < 0.05, ***: p < 0.001
Comparison of the menu planning between established area and non-established area by CCFSM
1) Frequency (%)
2) For respondents that say yes to the above question
3) The multiple responses
**: p < 0.01, ***: p < 0.001
Comparison of the menu operating between established area and non-established area by CCFSM
1) Frequency (%)
2) For respondents that say yes to the above question
3) The multiple responses
*: p < 0.05, **: p < 0.01, ***: p < 0.001
Comparison of the nutritional needs between established area and non-established area by CCFSM
1) Frequency (%)
2) For respondents that say yes to the above question
3) The multiple responses
*: p < 0.05, **: p < 0.01, ***: p < 0.001
Comparison of dietary variety between pre-support and post-support by CCFSM
1) Mean ± SD
2) Total (max. 100) = Nutrition (max. 50) + Food (max. 50) Valuation criteria: less than score 49 = need to more improve, score 50 - 74 = need to improve, more than score 75 = great
*: p < 0.05, ***: p < 0.001
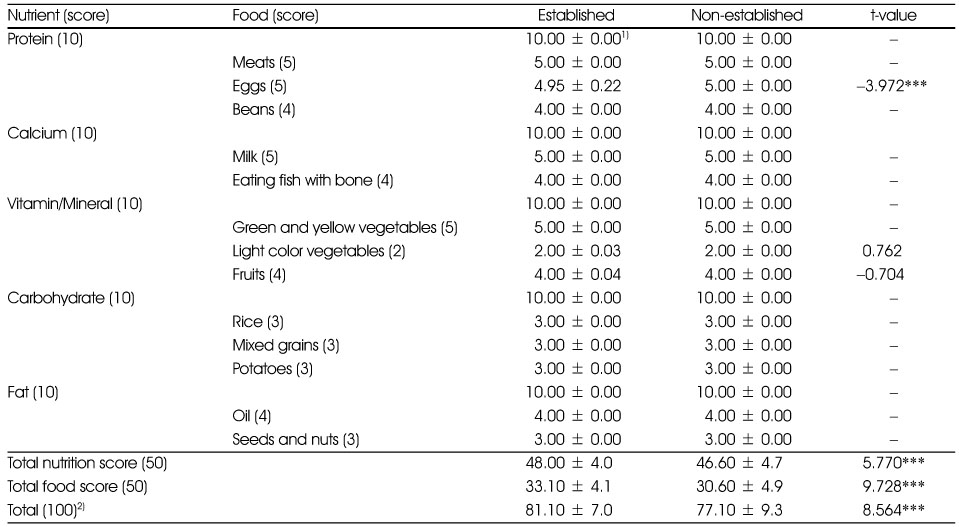
Comparison of dietary variety between established area and non-established area for CCFSM
1) Mean ± SD
2) Total (max. 100) = Nutrition (max. 50) + Food (max. 50) Valuation criteria: less than score 49 = need to more improve, score 50 - 74 = need to improve, more than score 75 = great
***: p < 0.001
1) N (%), 2) χ2-value, 3) Mean ± SD, 4) The multiple responses *: p < 0.05, **: p < 0.01, ***: p < 0.001
1) Frequency (%) 2) For respondents that say yes to the above question 3) The multiple responses **: p < 0.01, ***: p < 0.001
1) Frequency (%) 2) For respondents that say yes to the above question 3) The multiple responses ***: p < 0.001
1) Frequency (%) 2) For respondents that say yes to the above question 3) The multiple responses *: p < 0.05, ***: p < 0.001
1) Frequency (%) 2) For respondents that say yes to the above question 3) The multiple responses **: p < 0.01, ***: p < 0.001
1) Frequency (%) 2) For respondents that say yes to the above question 3) The multiple responses *: p < 0.05, **: p < 0.01, ***: p < 0.001
1) Frequency (%) 2) For respondents that say yes to the above question 3) The multiple responses *: p < 0.05, **: p < 0.01, ***: p < 0.001
1) Mean ± SD 2) Total (max. 100) = Nutrition (max. 50) + Food (max. 50) Valuation criteria: less than score 49 = need to more improve, score 50 - 74 = need to improve, more than score 75 = great *: p < 0.05, ***: p < 0.001
1) Mean ± SD 2) Total (max. 100) = Nutrition (max. 50) + Food (max. 50) Valuation criteria: less than score 49 = need to more improve, score 50 - 74 = need to improve, more than score 75 = great ***: p < 0.001

 KSCN
KSCN


 Cite
Cite


