
Articles
- Page Path
- HOME > Korean J Community Nutr > Volume 21(6); 2016 > Article
-
Research Article
- A Comparison of Sources of Sodium and Potassium Intake by Gender, Age and Regions in Koreans: Korea National Health and Nutrition Examination Survey (KNHANES) 2010-2012
-
Yang-hee Park, Sang-Jin Chung

-
Korean Journal of Community Nutrition 2016;21(6):558-573.
DOI: https://doi.org/10.5720/kjcn.2016.21.6.558
Published online: December 31, 2016
Department of Foods & Nutrition, Kookmin University, Seoul, Korea.
- Corresponding author: Sang-Jin Chung. Department of Foods and Nutrition, Kookmin University, 77 Jeongneung-ro, Seongbuk-gu, Seoul 02707, Korea. Tel: (02) 910-4777, Fax: (02) 910-5249, schung@kookmin.ac.kr
• Received: September 27, 2016 • Revised: December 15, 2016 • Accepted: December 23, 2016
Copyright © 2016 The Korean Society of Community Nutrition
This is an Open-Access article distributed under the terms of the Creative Commons Attribution Non-Commercial License (http://creativecommons.org/licenses/by-nc/3.0/) which permits unrestricted non-commercial use, distribution, and reproduction in any medium, provided the original work is properly cited.
- 3,817 Views
- 7 Download
- 19 Crossref
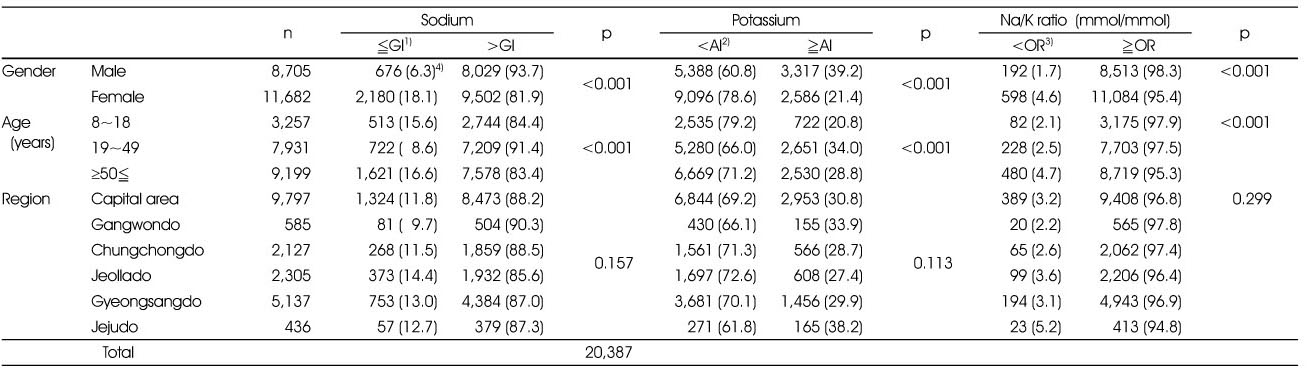
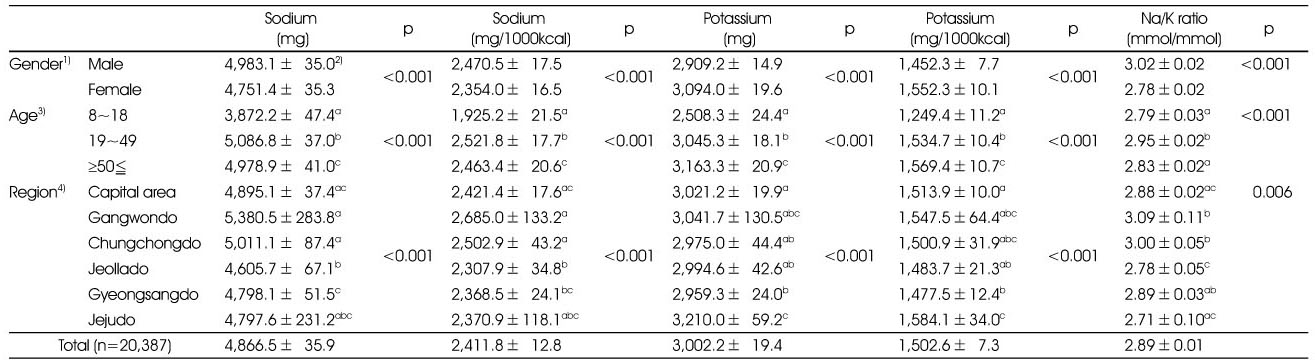
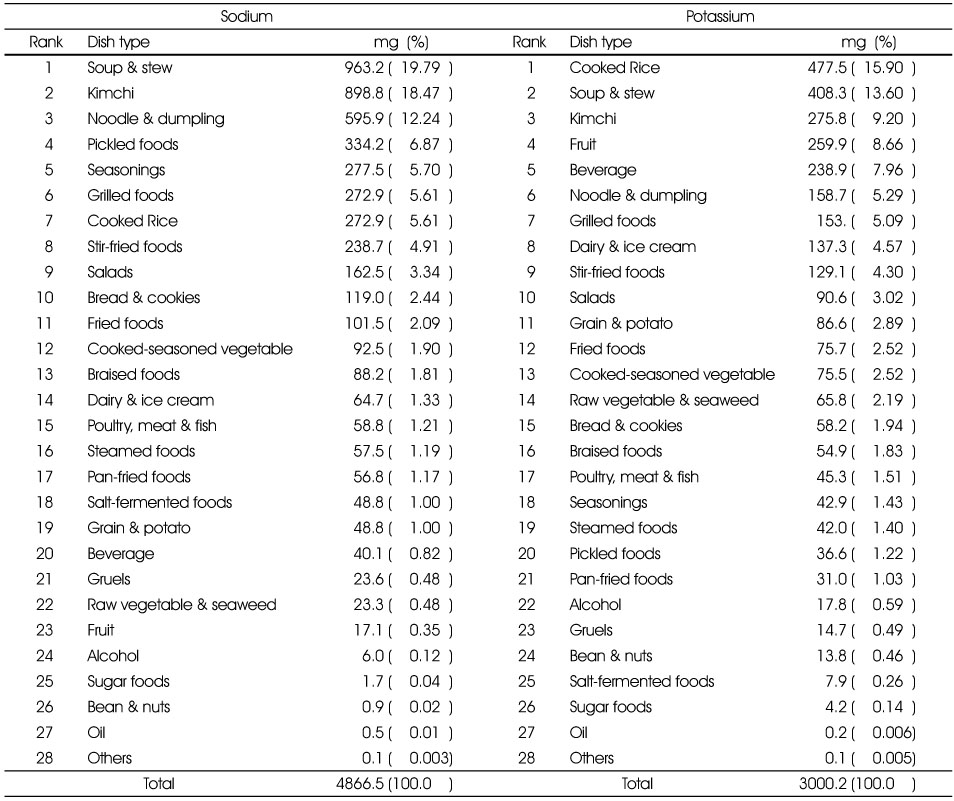
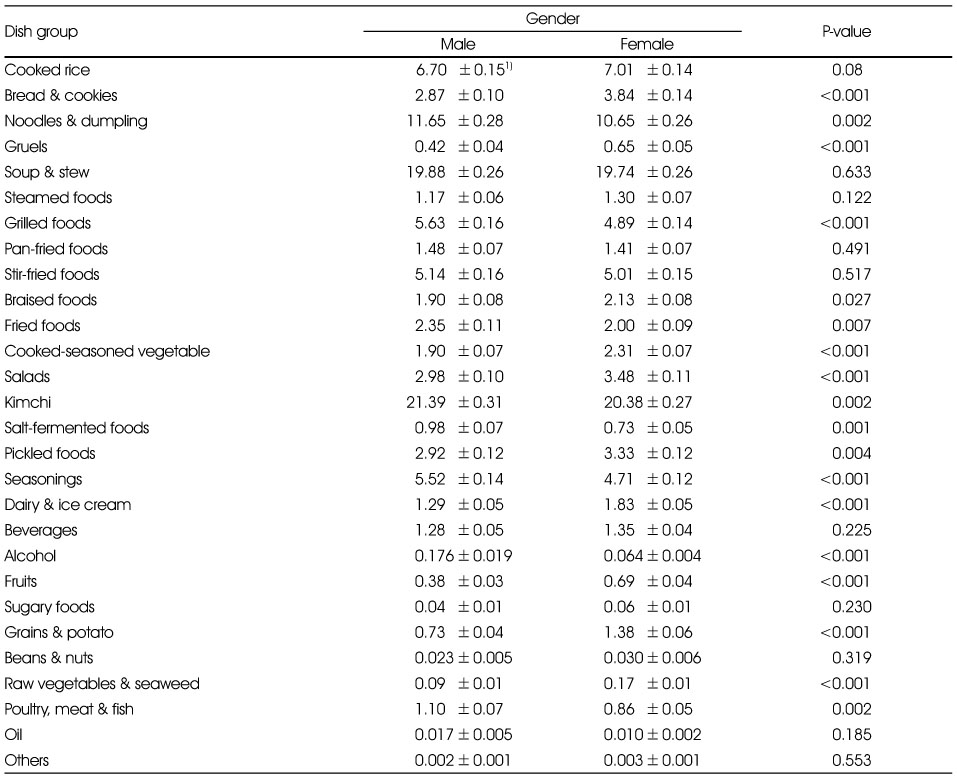
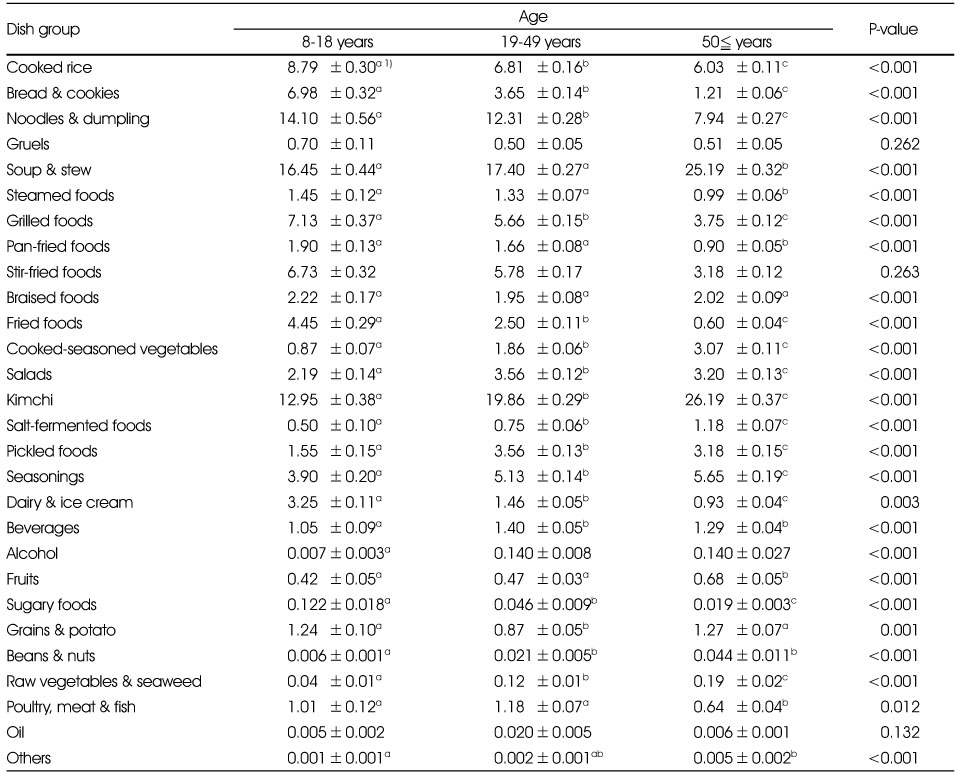
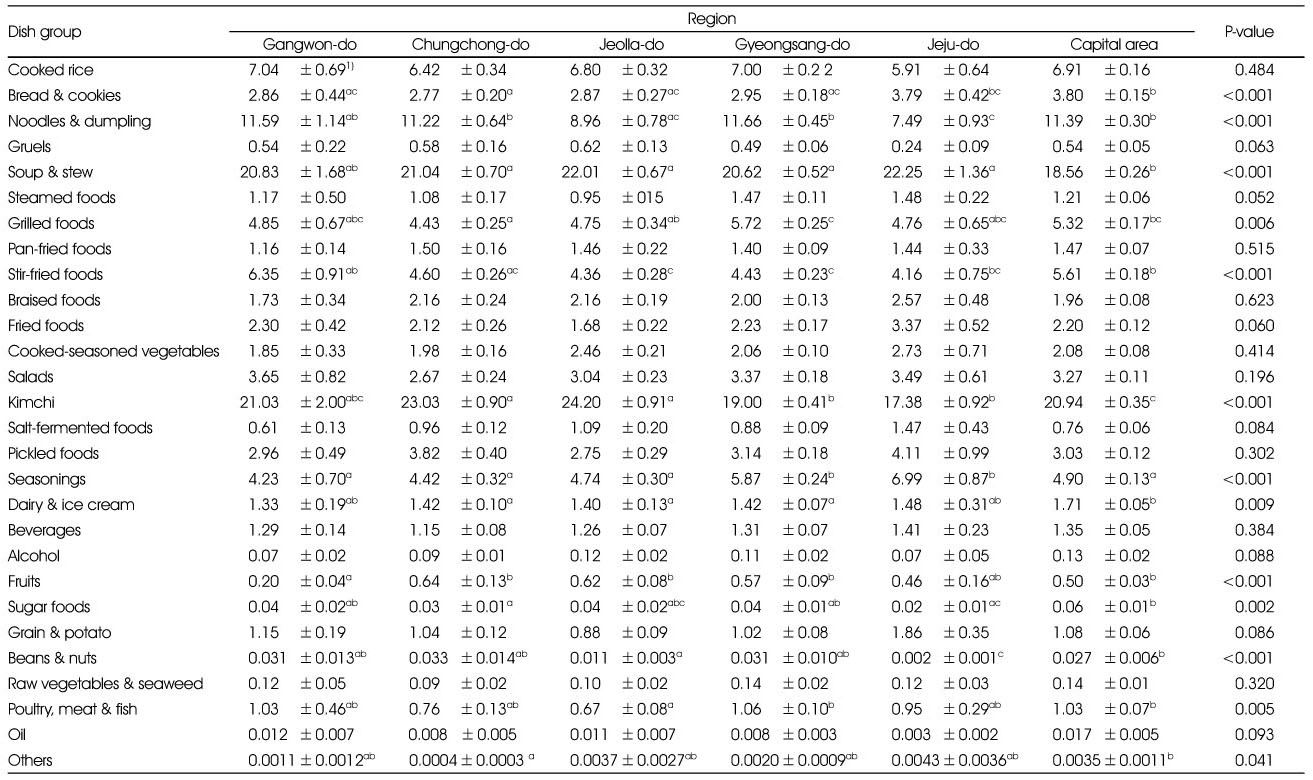
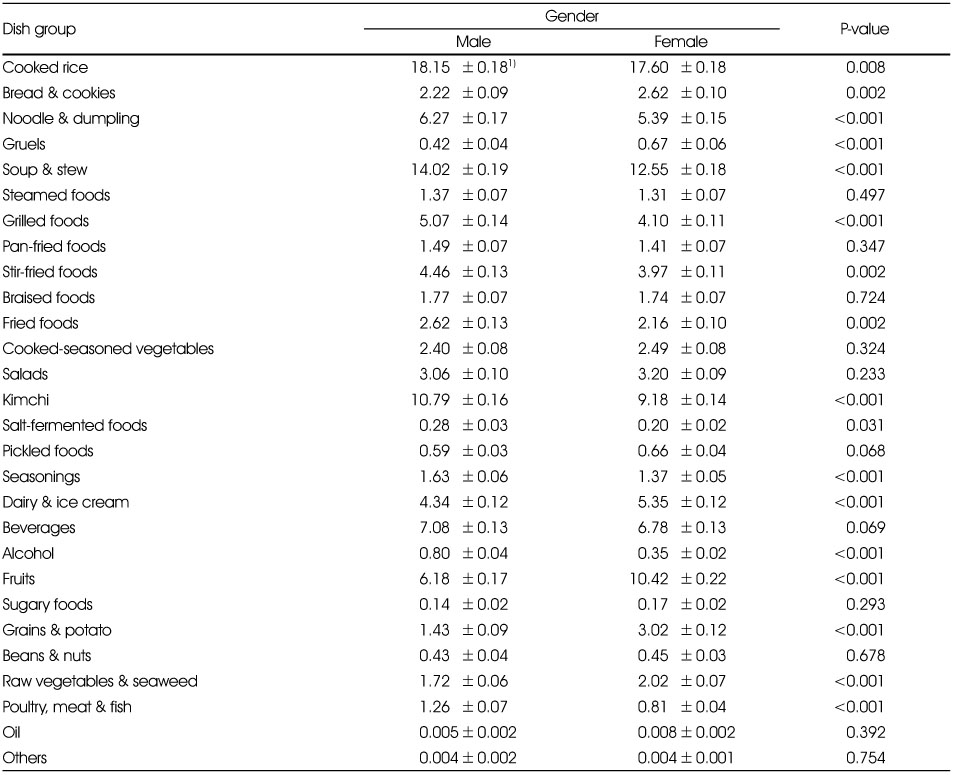
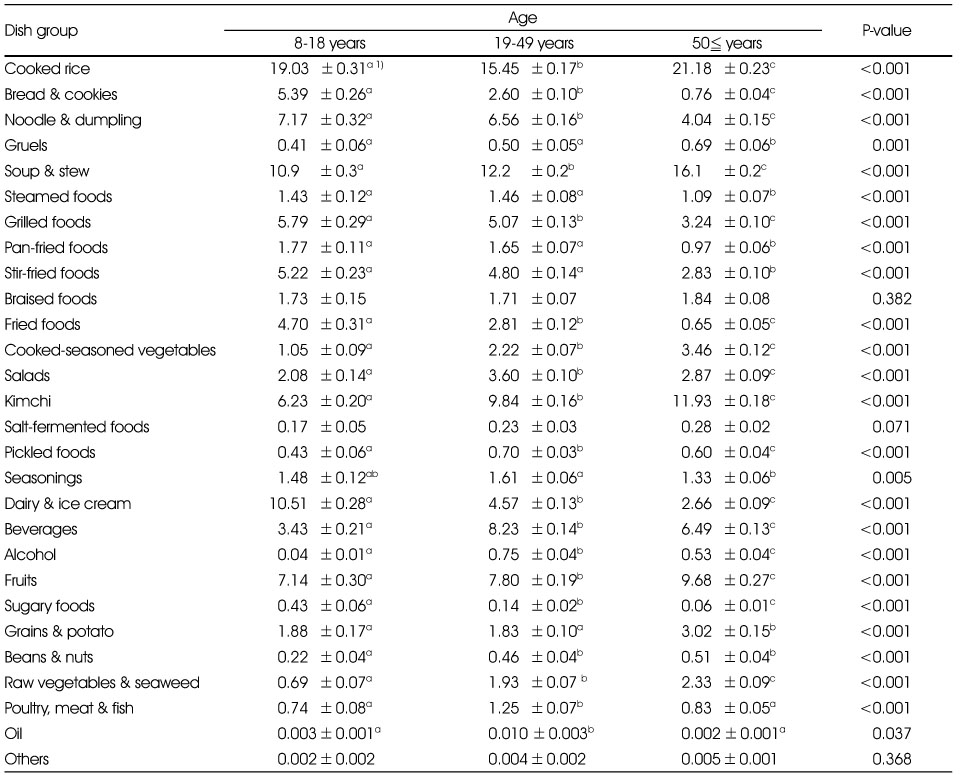
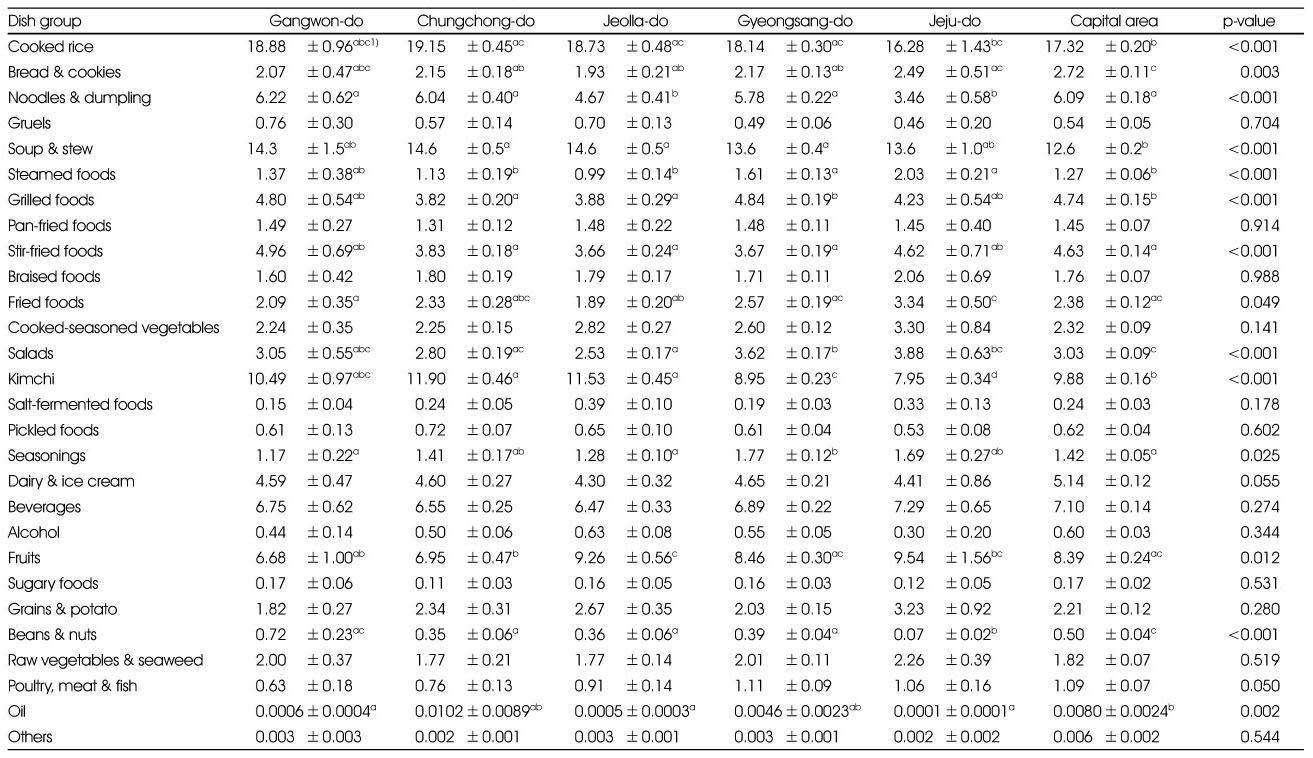
Figure & Data
REFERENCES
Citations
Citations to this article as recorded by 
- Nutrient intake and food consumption of Korean preschool children: a comparison between a daycare meal group and non-daycare meal group using the data from the 2016–2019 Korea National Health and Nutrition Examination Survey
Young-Hee Han, Taisun Hyun
Nutrition Research and Practice.2025; 19(2): 225. CrossRef - Dietary Habits of Newly Diagnosed Patients with Breast Cancer in Korea
Jaehoon Shin, Jiyeon Lee, Yooeun Yoon, Hye Sun Lee, Hyungmi Kim, Yu-Jin Kwon, Ji-Won Lee
Korean Journal of Family Medicine.2024; 45(3): 149. CrossRef - Role of geographic characteristics in the spatial cluster detection of cancer: Evidence in South Korea, 1999–2013
Insang Song, Eun-Hye Yoo, Inkyung Jung, Jin-Kyoung Oh, Sun-Young Kim
Environmental Research.2023; 236: 116841. CrossRef - Development and application of the sodium index to estimate and assess sodium intake for Korean adults
Yeon-Kyung Lee, Taisun Hyun, Heekyong Ro, Young-Ran Heo, Mi-Kyeong Choi
Nutrition Research and Practice.2022; 16(3): 366. CrossRef - Trends in sodium intake and major contributing food groups and dishes in Korea: the Korea National Health and Nutrition Examination Survey 2013–2017
Yeseung Jeong, Eui Su Kim, Jounghee Lee, Yuri Kim
Nutrition Research and Practice.2021; 15(3): 382. CrossRef - Predictive Analysis of Food Behavior and Related Factors Using Spatial Analysis: Based on Community Health Survey Data 2016
Se-Mi Jeong, Bok-Mi Jung
The Korean Journal of Community Living Science.2021; 32(2): 189. CrossRef - The association of dietary patterns with insulin resistance in Korean adults: based on the 2015 Korea National Health and Nutrition Examination Survey
I Seul Kim, Yoon Jung Yang
Journal of Nutrition and Health.2021; 54(3): 247. CrossRef - Effect of nutrition education in reducing sodium intake and increasing potassium intake in hypertensive adults
You-Sin Lee, Moo-Yong Rhee, Sim-Yeol Lee
Nutrition Research and Practice.2020; 14(5): 540. CrossRef - Comparison of Salinity and Sodium Content by the Salinity Measurement Frequency of Soups of Childcare Centers Enrolled in the Center for Children's Food Service Management in Daegu
Na-Yeong Lee, Yeon-Kyung Lee
Korean Journal of Community Nutrition.2020; 25(1): 13. CrossRef - Comparison of the sodium content of Korean soup-based dishes prepared at home, restaurants, and schools in Seoul
Yanghee Park, Jihyun Yoon, Sang-Jin Chung
Journal of Nutrition and Health.2020; 53(6): 663. CrossRef - Designing optimized food intake patterns for Korean adults using linear programming (II): adjustment of the optimized food intake pattern by establishing stepwise intake goals of sodium
Kana Asano, Hongsuk Yang, Youngmi Lee, Meeyoung Kim, Jihyun Yoon
Journal of Nutrition and Health.2019; 52(4): 342. CrossRef - The association between genetic variants of angiopoietin-like 3 and risk of diabetes mellitus is modified by dietary factors in Koreans
Clara Yongjoo Park, Jiyoung Moon, Garam Jo, Juhee Lee, Oh Yoen Kim, Hannah Oh, Hyunjung Lim, Min-Jeong Shin
Scientific Reports.2019;[Epub] CrossRef - Analysis of biogenic amines and inorganic elements in Cheonggukjang
Min-Jeong Seo, Chang-Do Lee, Ji-Na Lee, Hee-Jong Yang, Do-Youn Jeong, Gae-Ho Lee
Korean Journal of Food Preservation.2019; 26(1): 101. CrossRef - Association between Sodium Excretion and Obesity of Adults in Gwangju
Mijin Jo, Young-Ran Heo
Korean Journal of Community Nutrition.2018; 23(1): 38. CrossRef - Diet-Related Risk Factors for Incident Hypertension During an 11-Year Follow-Up: The Korean Genome Epidemiology Study
Hye Ah Lee, Hyesook Park
Nutrients.2018; 10(8): 1077. CrossRef - Study on the prevalence and incidence of urolithiasis in Korea over the last 10 years: An analysis of National Health Insurance Data
Joon Se Jung, Chang Hee Han, Sangrak Bae
Investigative and Clinical Urology.2018; 59(6): 383. CrossRef - Dietary status of young children in Korea based on the data of 2013 ~ 2015 Korea National Health and Nutrition Examination Survey
Eun-kyung Kim, Byengchun Song, Se-Young Ju
Journal of Nutrition and Health.2018; 51(4): 330. CrossRef - Effects of Sodium Intake on the Association between the Salt-Sensitive Gene, Alpha-Adducin 1 (ADD1), and Inflammatory Cytokines in the Prevalence of Children Obesity
Mi-Young Park, Myoung-sook Lee
Journal of Lipid and Atherosclerosis.2018; 7(2): 98. CrossRef - Dietary intakes of adolescents from food insecure households: analysis of data from the 6th(2013-2015) Korea National Health and Nutrition Examination Survey
Mariam Nakitto, Kana Asano, Injoo Choi, Jihyun Yoon
Nutrition Research and Practice.2017; 11(6): 507. CrossRef
 Cite
Cite- We recommend
- Related articles
-
- Ultra-processed food intake and dietary behaviors in Korean adolescents: a cross-sectional study based on the 2019–2023 Korea National Health and Nutrition Examination Survey
- Analysis of the relationship between sugar intake and cancer prevalence: a cross-sectional study using the 8th Korea National Health and Nutrition Examination Survey
- Total sugar intake and its contributed foods by age groups in Koreans using the 8th (2019–2021) Korea National Health and Nutrition Examination Survey: a cross-sectional study
A Comparison of Sources of Sodium and Potassium Intake by Gender, Age and Regions in Koreans: Korea National Health and Nutrition Examination Survey (KNHANES) 2010-2012
A Comparison of Sources of Sodium and Potassium Intake by Gender, Age and Regions in Koreans: Korea National Health and Nutrition Examination Survey (KNHANES) 2010-2012
Percentage of subjects with sodium and potassium intakes in accordance with Dietary Guideline for Korean by gender, age, and regions
1) GI: Goal Intake for sodium for Korea (≤2000 mg)
2) AI: Adequate Intake for potassium for Korea (8-18 year: ≥3000 mg, >19 year: ≥3500 mg)
3) OR: Optimal NA/K ratio by WHO (Na/K <1)
4) N (%): number of people (percent)
Comparison of intakes of sodium, and potassium intakes and Na/K ratio by gender, age and region
1) Adjusted for age and energy intake.
2) Least Square Mean±Standard Error
3) Adjusted for gender and energy intake.
4) Adjusted for gender, age and energy intake.
The proportion of sodium and potassium intake by dish groups
Comparison of sodium intake rate of each dish group by gender
1) Least Square Mean±Standard Error (%)
Comparison of sodium intake rate of each dish group by age
1) Least Square Mean±Standard Error (%)
Comparison of sodium intake rate of each dish group by regions
1) Least Square Mean±Standard Error (%)
Comparison of potassium intake rate of each dish group by gender
1) Least Square Mean±Standard Error (%)
Comparison of potassium intake rate of each dish group by age groups
1) Least Square Mean±Standard Error (%)
Comparison of potassium intake rate of each dish group by regions
1) Least Square Mean±Standard Error (%)
Table 1
Percentage of subjects with sodium and potassium intakes in accordance with Dietary Guideline for Korean by gender, age, and regions
1) GI: Goal Intake for sodium for Korea (≤2000 mg) 2) AI: Adequate Intake for potassium for Korea (8-18 year: ≥3000 mg, >19 year: ≥3500 mg) 3) OR: Optimal NA/K ratio by WHO (Na/K <1) 4) N (%): number of people (percent)
Table 2
Comparison of intakes of sodium, and potassium intakes and Na/K ratio by gender, age and region
1) Adjusted for age and energy intake. 2) Least Square Mean±Standard Error 3) Adjusted for gender and energy intake. 4) Adjusted for gender, age and energy intake.
Table 3
The proportion of sodium and potassium intake by dish groups
Table 4
Comparison of sodium intake rate of each dish group by gender
1) Least Square Mean±Standard Error (%)
Table 5
Comparison of sodium intake rate of each dish group by age
1) Least Square Mean±Standard Error (%)
Table 6
Comparison of sodium intake rate of each dish group by regions
1) Least Square Mean±Standard Error (%)
Table 7
Comparison of potassium intake rate of each dish group by gender
1) Least Square Mean±Standard Error (%)
Table 8
Comparison of potassium intake rate of each dish group by age groups
1) Least Square Mean±Standard Error (%)
Table 9
Comparison of potassium intake rate of each dish group by regions
1) Least Square Mean±Standard Error (%)


