
Articles
- Page Path
- HOME > Korean J Community Nutr > Volume 28(5); 2023 > Article
-
Research Article
청소년의 비만과 관련된 요인 분석 및 관련 요인의 변화에 대한 단면조사연구 -청소년건강행태조사를 이용하여- -
이보라1)
 , 류호경2),†
 - Factors related to adolescent obesity and changes: a cross-sectional study based on the Korea Youth Risk Behavior Survey
-
Bora Lee1), Ho Kyung Ryu2),†
-
Korean Journal of Community Nutrition 2023;28(5):363-375.
DOI: https://doi.org/10.5720/kjcn.2023.28.5.363
Published online: October 31, 2023
1)부산대학교 교육대학원 영양교육전공, 대학원생
2)부산대학교 생활과학대학 식품영양학과, 교수
1)Student, Graduate School of Education, Pusan National University, Busan, Korea
2)Professor, Department of Food Science and Nutrition, College of Human Ecology, Pusan National University, Busan, Korea
- †Corresponding author Ho Kyung Ryu Department of Food Science and Nutrition, Pusan National University, 2 Busandaehak-ro 63beon-gil, Geumjeong-gu, Busan 46241, Korea Tel: 82-51-510-7397 Fax: 82-51-583-3648 E-mail: hokryu@pusan.ac.kr
• Received: July 10, 2023 • Revised: August 29, 2023 • Accepted: October 17, 2023
© 2023 The Korean Society of Community Nutrition
This is an Open-Access article distributed under the terms of the Creative Commons Attribution Non-Commercial License (http://creativecommons.org/licenses/by-nc/4.0) which permits unrestricted non-commercial use, distribution, and reproduction in any medium, provided the original work is properly cited.
- 3,112 Views
- 56 Download
- 1 Crossref
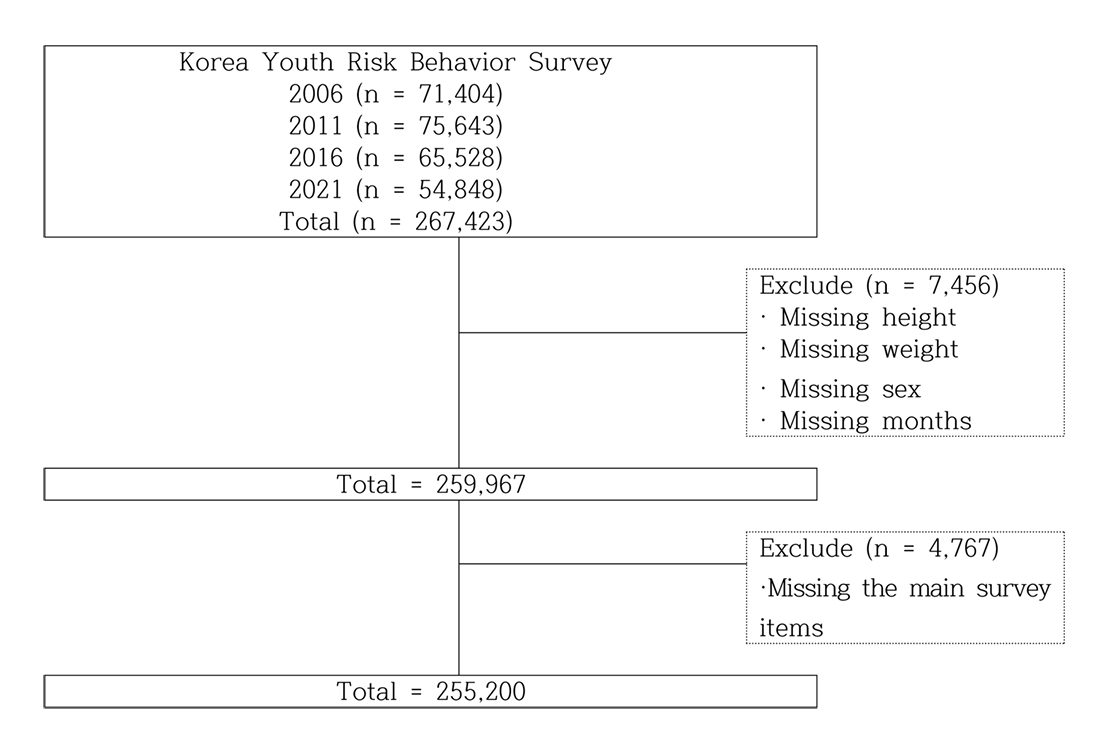
Figure & Data
REFERENCES
Citations
Citations to this article as recorded by 
- Effects of watching Mukbang and Cookbang videos on adolescents’ dietary habits and mental health: cross-sectional study using the 18th Korea Youth Risk Behavior Survey
Seung-Hee Hong
Korean Journal of Community Nutrition.2024; 29(2): 156. CrossRef
 Cite
Cite- Figure
-
- We recommend
- Related articles
-
- Ultra-processed food intake and dietary behaviors in Korean adolescents: a cross-sectional study based on the 2019–2023 Korea National Health and Nutrition Examination Survey
- Effects of night eating on oral health characteristics and symptoms of poor oral health in adolescents: a cross-sectional study using the 18th Korea Youth Risk Behavior Survey
- Analysis of the relationship between sugar intake and cancer prevalence: a cross-sectional study using the 8th Korea National Health and Nutrition Examination Survey
- Effects of watching Mukbang and Cookbang videos on adolescents’ dietary habits and mental health: cross-sectional study using the 18th Korea Youth Risk Behavior Survey
Factors related to adolescent obesity and changes: a cross-sectional study based on the Korea Youth Risk Behavior Survey
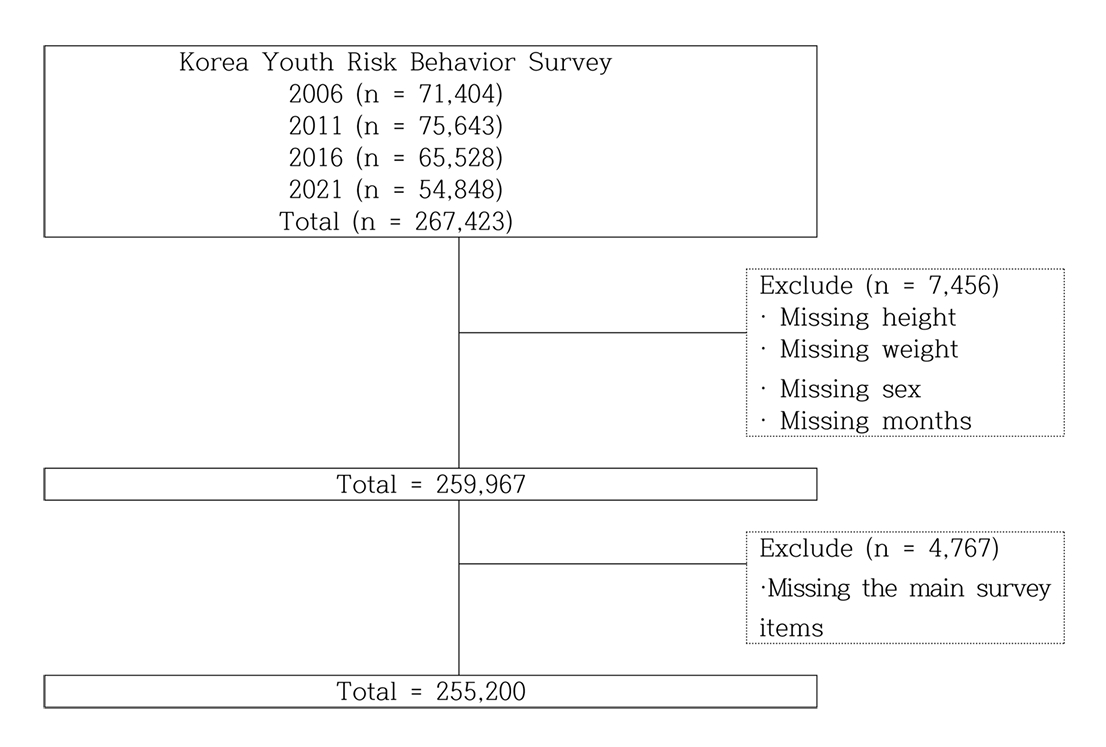
Fig. 1. Selection of study subject
Fig. 1.
Factors related to adolescent obesity and changes: a cross-sectional study based on the Korea Youth Risk Behavior Survey
| Variables | Year | ||||
|---|---|---|---|---|---|
| 2006 (n = 68,345) | 2011 (n = 73,438) | 2016 (n = 61,144) | 2021 (n = 52,273) | Total (n = 255,200) | |
| Middle school | |||||
| Boys | 18,648 (28.4) | 18,995 (25.9) | 15,581 (23.6) | 14,986 (26.4) | 68,210 (26.2) |
| Girls | 17,163 (25.5) | 18,411 (23.7) | 14,371 (21.6) | 13,700 (24.7) | 63,645 (23.9) |
| Total | 35,811 (53.9) | 37,406 (49.6) | 29,952 (45.2) | 28,686 (51.1) | 131,855 (50.1) |
| High school | |||||
| Boys | 16,720 (24.2) | 17,740 (26.7) | 15,937 (28.5) | 12,219 (25.4) | 62,616 (26.2) |
| Girls | 15,814 (21.8) | 18,292 (23.7) | 15,255 (26.3) | 11,368 (23.4) | 60,729 (23.7) |
| Total | 32,534 (46.0) | 36,032 (50.4) | 31,192 (54.8) | 23,587 (48.8) | 123,345 (49.9) |
| Body composition | |||||
| Underweight | 5,768 (8.5) | 6,329 (8.8) | 4,452 (7.3) | 4,175 (8.2) | 20,724 (8.1) |
| Normal | 53,428 (78.3) | 57,532 (78.4) | 45,605 (74.7) | 35,662 (68.3) | 192,227 (75.3) |
| Overweight | 5,174 (7.4) | 5,413 (7.2) | 5,451 (8.8) | 5,289 (10.0) | 21,327 (8.4) |
| Obesity | 3,975 (5.8) | 4,164 (5.6) | 5,636 (9.1) | 7,147 (13.4) | 20,922 (8.2) |
| Variable | Nomal weight (n = 192,227) | Obesity (n = 20,922) | P-value | |
|---|---|---|---|---|
| Household economic status | ||||
| High | (n = 71,056) | 64,105 (34.2) | 6,951 (33.9) | < 0.001 |
| Middel | (n = 102,738) | 93,001 (48.0) | 9,737 (46.0) | |
| Low | (n = 39,355) | 35,121 (17.8) | 4,234 (20.2) | |
| Academic performance | ||||
| High | (n = 80,798) | 74,077 (38.6) | 6,721 (31.6) | < 0.001 |
| Middel | (n = 60,727) | 54,909 (28.5) | 5,818 (27.7) | |
| Low | (n = 71,624) | 63,241 (32.9) | 8,383 (40.7) | |
| Living with parents | ||||
| Parents | (n = 170,672) | 154,941 (81.7) | 15,731 (76.1) | < 0.001 |
| Only father | (n = 8,871) | 7,900 (3.8) | 971 (4.3) | |
| Only mother | (n = 17,615) | 15,696 (8.0) | 1,919 (9.0) | |
| Not living with parents | (n = 15,991) | 13,690 (6.6) | 2,301 (10.6) | |
| Father's educational level | ||||
| Below middle school graduation | (n = 9,854) | 8,898 (4.3) | 956 (4.7) | < 0.001 |
| High school graduation | (n = 66,801) | 60,426 (32.8) | 6,375 (34.3) | |
| Above college graduation | (n = 90,885) | 83,040 (49.1) | 7,845 (44.6) | |
| Mother's educational level | ||||
| Below middle school graduation | (n = 10,503) | 9,543 (4.7) | 960 (4.9) | < 0.001 |
| High school graduation | (n = 83,829) | 76,185 (42.2) | 7,644 (41.7) | |
| Above college graduation | (n = 74,456) | 67,646 (39.5) | 6,810 (37.6) | |
| Breakfast intake frequency | ||||
| 0 time/week | (n = 31,800) | 28,297 (14.6) | 3,503 (16.7) | < 0.001 |
| 1-2 times/week | (n = 28,831) | 25,757 (13.3) | 3,074 (15.0) | |
| 3-5 times/week | (n = 49,442) | 44,329 (22.8) | 5,113 (24.1) | |
| 6-7 times/week | (n = 103,076) | 93,844 (49.3) | 9,232 (44.3) | |
| Fruit intake frequency | ||||
| ≤ 2 times/week | (n = 85,146) | 75,788 (38.4) | 9,358 (44.2) | < 0.001 |
| 3-6 times/week | (n = 79,214) | 71,422 (36.9) | 7,792 (37.0) | |
| Everyday | (n = 48,789) | 45,017 (24.7) | 3,772 (18.8) | |
| Carbonated beverage intake frequency | ||||
| 0 time/week | (n = 55,507) | 50,271 (26.4) | 5,236 (25.3) | 0.002 |
| 1-2 times/week | (n = 96,795) | 87,326 (45.3) | 9,469 (45.3) | |
| ≥ 3 times/week | (n = 60,847) | 54,630 (28.3) | 6,217 (29.4) | |
| Fast-food intake frequency | ||||
| 0 times/week | (n = 59,602) | 53,675 (27.8) | 5,927 (28.4) | 0.047 |
| 1-2 times/week | (n = 118,964) | 107,442 (56.1) | 11,522 (55.2) | |
| ≥ 3 times/week | (n = 34,583) | 31,110 (16.0) | 3,473 (16.4) | |
| Nutrition education in the past 12 months | ||||
| No | (n = 121,856) | 109,840 (57.7) | 12,016 (58.4) | 0.078 |
| Yes | (n = 91,293) | 82,387 (42.3) | 8,906 (41.6) | |
| Intense physical activity | ||||
| ≤ 1 times/week | (n = 102,907) | 93,461 (48.9) | 9,446 (45.2) | < 0.001 |
| 2-3 times/week | (n = 60,316) | 60,177 (31.3) | 139 (34.3) | |
| ≥ 4 times/week | (n = 42,926) | 38,589 (19.8) | 4,337 (20.5) | |
| Muscle strengthening exercise | ||||
| ≤ 1 times/week | (n = 144,209) | 129,639 (67.4) | 14,570 (69.8) | < 0.001 |
| 2-3 times/week | (n = 41,539) | 37,543 (19.6) | 3,996 (19.0) | |
| ≥ 4 times/week | (n = 27,401) | 25,045 (13.0) | 2,356 (11.2) | |
| Weekday sitting duration | ||||
| < 2 hours/day | (n = 85,064) | 78,072 (41.0) | 6,992 (33.9) | < 0.001 |
| ≤ 2-3 hours/day | (n = 83,844) | 75,402 (39.2) | 8,442 (40.2) | |
| ≥ 4 hours/day | (n = 44,241) | 38,753 (19.8) | 5,488 (25.9) | |
| Weekend sitting duration | ||||
| < 2 hours/day | (n = 48,602) | 45,004 (24.4) | 3,598 (17.8) | < 0.001 |
| ≤ 2-3 hours/day | (n = 76,737) | 70,184 (37.2) | 6,553 (31.8) | |
| ≥ 4 hours/day | (n = 87,810) | 70,184 (38.6) | 6,553 (50.4) | |
| Frequency of alcohol consumption | ||||
| 0 day/month | (n = 172,044) | 154,703 (80.2) | 17,341 (82.8) | < 0.001 |
| 1-9 days/month | (n = 35,687) | 32,597 (17.2) | 3,090 (14.9) | |
| ≥ 10 days/month | (n = 5,418) | 4,927 (2.6) | 491 (2.3) | |
| Frequency of smoking | ||||
| 0 day/month | (n = 194,137) | 174,835 (90.7) | 19,302 (92.0) | < 0.001 |
| 1-29 days/month | (n = 10,161) | 9,286 (4.9) | 875 (4.3) | |
| Everyday | (n = 8,851) | 8,106 (4.4) | 745 (3.7) | |
| Stress recognition | ||||
| A great deal | (n = 87,554) | 78,393 (40.9) | 9,161 (43.6) | < 0.001 |
| A little bit | (n = 88,886) | 80,648 (41.9) | 8,238 (39.8) | |
| Not much | (n = 36,709) | 33,186 (17.1) | 3,523 (16.6) | |
| Sadness and despair experiences over the past year | ||||
| No | (n = 144,883) | 130,243 (67.5) | 14,640 (70.0) | < 0.001 |
| Yes | (n = 68,266) | 61,984 (32.5) | 6,282 (30.0) | |
| OR (95% Cl) | ||||
|---|---|---|---|---|
| 2006 | 2011 | 2016 | 2021 | |
| Household economic status (level) | ||||
| High | 1 | 1 | 1 | 1 |
| Middle | 0.83 (0.74-0.93) |
0.9 (0.84-0.98) |
1.02 (0.95-1.08) | 1.03 (0.97-1.09) |
| Low | 1.04 (0.92-1.93) | 1.09 (0.97-1.20) | 1.43 (1.30-1.56) |
1.35 (1.23-1.48) |
| Ability of academic performance | ||||
| High | 1 | 1 | 1 | 1 |
| Middle | 1.14 (1.03-1.26) |
1.1 (1.01-1.20) |
1.13 (1.04-1.21) |
1.19 (1.11-1.27) |
| Low | 1.44 (1.34-1.63) |
1.44 (1.34-1.57) |
1.55 (1.44-1.66) |
1.56 (1.46-1.66) |
| Living with parents | ||||
| Parents | 1 | 1 | 1 | 1 |
| Only father | 0.92 (0.75-1.13) | 1.04 (0.88-1.22) | 1.22 (1.07-1.40) |
1.44 (1.24-1.68) |
| Only mother | 1.03 (0.90-1.18) | 1.07 (0.95-1.21) | 1.16 (1.06-1.27) |
1.27 (1.10-1.40) |
| Not living with parents | 1.18 (0.95-1.46) | 1.06 (0.88-1.29) | 0.99 (0.82-1.20) | 1.12 (1.05-1.19) |
| Father's educational level | ||||
| Above college graduation | 1 | 1 | 1 | |
| High school graduation | 1.12 (1.06-1.23) |
1.2 (1.10-1.31) |
1.31 (1.23-1.40) |
1.40 (1.29-1.52) |
| Below middle school graduation | 1.17 (1.02-1.35) |
1.48 (1.28-1.71) |
1.68 (1.41-2.01) |
1.83 (1.44-2.32) |
| Mother's educational level | 1.034 (0.911-1.175) | 1.034 (0.911-1.175) | ||
| Abovecollege graduation | ||||
| High school graduation | 1 | 1 | 1 | 1 |
| Below middle school graduation | 1.17 (1.06-1.30) |
1.08 (1.0-1.17) |
1.29 (1.21-1.37) |
1.33 (1.23-1.44) |
| OR (95% Cl) | ||||
|---|---|---|---|---|
| 2006 | 2011 | 2016 | 2021 | |
| Breakfast intake | ||||
| 6-7 times/week | 1 | 1 | 1 | 1 |
| 3-5 times/week | 0.98 (0.86-1.12) | 0.94 (0.86-1.03) | 1.00 (0.93-1.08) | 1.02 (0.94-1.11) |
| 1-2 times/week | 1.11 (0.98-1.25) | 0.97 (0.86-1.08) | 0.97 (0.88-1.07) | 0.99 (0.90-1.09) |
| 0 time/week | 0.93 (0.82-1.05) | 0.94 (0.88-1.05) | 0.96 (0.88-1.05) | 0.94 (0.86-1.02) |
| Fruit intake frequency | ||||
| Everyday | 1 | 1 | 1 | 1 |
| 3-6 times/week | 1.12 (1.01-1.24) |
1.31 (1.18-1.46) |
1.22 (1.13-1.33) |
1.17 (1.06-1.29) |
| ≥ 2 times/week | 1.24 (1.11-1.39) |
1.44 (1.30-1.61) |
1.30 (1.20-1.41) |
1.20 (1.10-1.32) |
| Carbonated beverage intake frequency | ||||
| 0 time/week | 1 | 1 | 1 | 1 |
| 1-2 times/week | 0.94 (0.85-1.05) | 0.95 (0.88-1.03) | 1.04 (0.96-1.27) | 1.11 (1.02-1.20) |
| ≥ 3 times/week | 0.86 (0.77-0.97) |
0.92 (0.36-1.01) | 0.91 (0.83-0.99) |
1.13 (1.04-1.24) |
| Fast-food intake frequency | ||||
| 0 time/week | 1 | 1 | 1 | 1 |
| 1-2 times/week | 0.76 (0.69-0.83) |
0.78 (0.72-0.83) |
0.90 (0.84-1.97) |
0.93 (0.85-1.01) |
| ≥ 3 times/week | 0.67 (0.59-0.76) |
0.70 (0.62-0.79) |
0.75 (0.68-0.83) |
0.86 (0.78-0.95) |
| OR (95% Cl) | ||||
|---|---|---|---|---|
| 2006 | 2011 | 2016 | 2021 | |
| Intense physical activity | ||||
| ≥ 4 times/week | 1 | 1 | 1 | 1 |
| 2-3 times/week | 0.99 (0.88-1.12) | 1.09 (0.99-1.20) | 1.05 (0.97-1.14) | 1.15 (1.05-1.26) |
| ≤ 1 times/week | 0.73 (0.65-0.81) |
0.85 (0.78-0.94) |
0.86 (0.80-0.93) |
0.92 (0.84-1.01) |
| Muscle strengthening exercise | ||||
| ≥ 4 times/week | 1 | 1 | 1 | 1 |
| 2-3 times/week | 0.98 (0.82-1.16) | 1.21 (1.04-1.40) |
1.20 (1.07-1.34) |
1.55 (1.39-1.60) |
| ≤ 1 times/week | 1.07 (0.91-1.25) | 1.24 (1.09-1.41) |
1.25 (1.14-1.37) |
1.45 (1.31-1.60) |
| Weekday sitting duration | ||||
| < 2 hours/day | 1 | 1 | 1 | 1 |
| ≤ 2-3 hours/day | 1.06 (0.96-1.18) | 1.06 (0.98-1.14) | 1.05 (0.98-1.12) | 1.12 (1.03-1.22) |
| ≥ 4 hours/day | 1.35 (1.17-1.54) |
1.17 (1.07-1.28) |
1.03 (0.94-1.12) | 1.19 (1.09-1.31) |
| Weekend sitting duration | ||||
| < 2 hours/day | 1 | 1 | 1 | 1 |
| ≤ 2-3 hours/day | 1.11 (1.00-1.23) |
1.07 (0.98-1.17) | 1.10 (0.99-1.21) | 1.12 (0.99-1.26) |
| ≥ 4 hours/day | 1.31 (1.15-1.49) |
1.30 (1.18-1.43) |
1.26 (1.14-1.38) |
1.35 (1.21-1.51) |
| Frequency of alcohol consumption | ||||
| 0 day/month | 1 | 1 | 1 | 1 |
| 1-9 days/month | 0.80 (0.72-0.89) |
0.83 (0.75-0.93) |
1.03 (0.94-1.12) | 1.15 (1.04-1.27) |
| ≥ 10 days/month | 0.86 (0.71-1.04) | 0.75 (0.59-0.94) |
1.39 (1.08-1.78) |
1.29 (0.99-1.68) |
| Frequency of smoking | ||||
| 0 day/month | 1 | 1 | 1 | 1 |
| 1-29 days/month | 0.90 (0.76-1.07) | 0.94 (0.80-1.10) | 1.11 (0.94-1.31) | 1.04 (0.83-1.29) |
| Everyday | 1.02 (0.85-1.22) | 0.77 (0.64-0.93) |
0.91 (0.75-1.10) | 0.82 (0.64-1.06) |
| OR (95% Cl) | ||||
|---|---|---|---|---|
| 2006 | 2011 | 2016 | 2021 | |
| Stress recognition | ||||
| Not much | 1 | 1 | 1 | 1 |
| A little bit | 1.09 (0.93-1.29) | 1.04 (0.95-1.15) | 0.94 (0.87-1.02) | 0.97 (0.89-1.06) |
| A great deal | 1.23 (1.07-1.43) |
1.19 (1.08-1.31) |
1.08 (1.04-1.18) |
1.14 (1.04-1.25) |
| Sadness and despair experiences | ||||
| Over the past year | ||||
| No | 1 | 1 | 1 | 1 |
| Yes | 0.99 (0.91-1.08) | 0.97 (0.90-1.04) | 0.91 (0.84-0.97) |
0.91 (0.85-0.98) |
Table 1. Demographic and body composition distribution of participants from 2006 to 2021
n (weighted %)
Table 2. Comparison of lifestyle and socioeconomic factors between normal weight and obese participants
n (weighted %) This table represents the results of analyzing data from the years 2006, 2011, 2016, and 2021, all combined.
Table 3. Association between demographic factors and obesity: 2006-2021
OR, odds ratio; CI, confidence interval
Table 4. Association between dietary factors and obesity: 2006-2021
OR, odds ratio; CI, confidence interval
Table 5. Association between health behavior factors and obesity: 2006-2021
OR, odds ratio; 95% CI, 95% confidence interval
Table 6. Association between mental health factors and obesity: 2006-2021
OR, odds ratio; 95% CI, 95% confidence interval


