
Articles
- Page Path
- HOME > Korean J Community Nutr > Volume 28(3); 2023 > Article
-
Research Article
- Screen time, mealtime media use, and dietary behaviors in Korean preschoolers : a cross-sectional study
-
Young-Hee Han1)
 , Saerom Shin2), Eun Yeol Woo3), Hye-Kyung Park4), Taisun Hyun5),†
 -
Korean Journal of Community Nutrition 2023;28(3):206-219.
DOI: https://doi.org/10.5720/kjcn.2023.28.3.206
Published online: June 30, 2023
1)Invited professor, Department of Food and Nutrition, Chungbuk National University, Cheongju, Korea
2)Team member, National Institute of Food & Nutrition Service, Cheongju, Korea
3)Team leader, National Institute of Food & Nutrition Service, Cheongju, Korea
4)Former center director, National Institute of Food & Nutrition Service, Cheongju, Korea
5)Professor, Department of Food and Nutrition, Chungbuk National University, Cheongju, Korea
- †Corresponding author Taisun Hyun Department of Food and Nutrition, Chungbuk National University, Chungdaero-1, Heungduk-gu, Cheongju, Chungbuk 28644, Korea Tel: +82-43-261-2790 Fax: +82-43-267-2742 Email: taisun@cbnu.ac.kr
• Received: June 7, 2023 • Revised: June 20, 2023 • Accepted: June 21, 2023
© 2023 The Korean Society of Community Nutrition
This is an Open-Access article distributed under the terms of the Creative Commons Attribution Non-Commercial License (http://creativecommons.org/licenses/by-nc/4.0) which permits unrestricted non-commercial use, distribution, and reproduction in any medium, provided the original work is properly cited.
- 8,219 Views
- 163 Download
- 3 Crossref
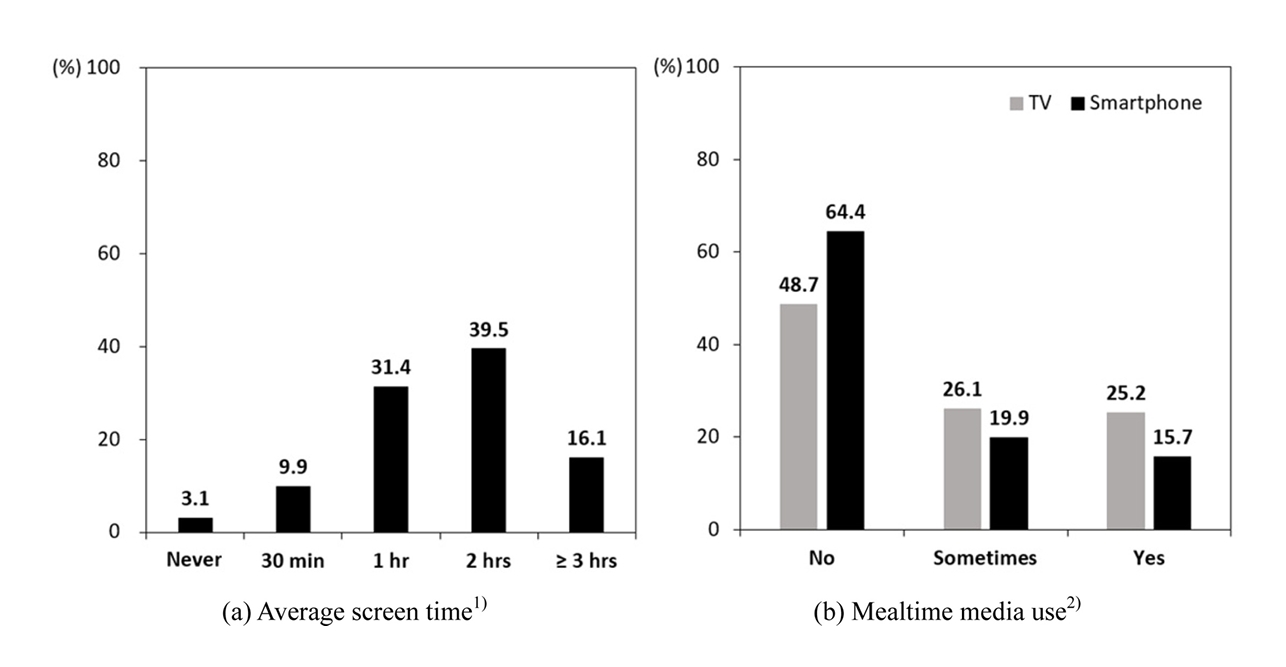
Figure & Data
REFERENCES
Citations
Citations to this article as recorded by 
- Evaluation of young children’s dietary behaviors by parental growth concern levels in Gyeonggi area: a descriptive study
Youn-Rok Kang, Hyung-Sook Kim
Korean Journal of Community Nutrition.2026; 31(1): 75. CrossRef - Screen Use While Eating and Toddler Dietary Intake in Mexican American Families
Darcy A. Thompson, Laura K. Kaizer, Sarah J. Schmiege, Natasha J. Cabrera, Lauren Clark, Haley Ringwood, Estefania Miramontes Valdes, Andrea Jimenez-Zambrano, Monica McNulty, Jeanne M. Tschann
Journal of Nutrition Education and Behavior.2026;[Epub] CrossRef - Exploring the impact of screen time, food advertising, and nutritional knowledge of parents on eating habits in preschoolers: a comprehensive review
P. Nagadharshini, Veena B. M., Shweatha H. E.
International Journal Of Community Medicine And Public Health.2025; 12(8): 3836. CrossRef
 Cite
Cite- Figure
-
- We recommend
- Related articles
-
- The association between sodium index and the risk of obesity in Korean and Chinese university students: a cross-sectional study
- Ultra-processed food intake and dietary behaviors in Korean adolescents: a cross-sectional study based on the 2019–2023 Korea National Health and Nutrition Examination Survey
- Nutrition Quotient and nutrient intake among older adults in a rural Korean community: a cross-sectional study
- Associations between diet quality and regional factors in Korea vary according to individuals’ characteristics: a cross-sectional study
- Adult consumers’ perception of plant-based meat substitutes and related factors in Korea: a cross-sectional study
Screen time, mealtime media use, and dietary behaviors in Korean preschoolers : a cross-sectional study

Fig. 1. Percentage of children by (a) average screen time and (b) mealtime media use. 1) Time spent using TV, smartphones, computers, and tablets; 2) Use of TV or smartphone during meals
Fig. 1.
Screen time, mealtime media use, and dietary behaviors in Korean preschoolers : a cross-sectional study
| Total (n = 261) | Screen time |
Mealtime media use |
||||||
|---|---|---|---|---|---|---|---|---|
| < 2 hours (n = 116) | ≥ 2 hours (n = 145) | P-value |
No (n = 110) | Sometimes (n = 71) | Yes (n = 80) | P-value |
||
| Sex | ||||||||
| Boy | 126 (48.3) | 52 (44.8) | 74 (51.0) | 0.319 | 51 (46.4) | 36 (50.7) | 39 (48.8) | 0.845 |
| Girl | 135 (51.7) | 64 (55.2) | 71 (49.0) | 59 (53.6) | 35 (49.3) | 41 (51.3) | ||
| Age (years) | ||||||||
| 3 | 62 (23.8) | 28 (24.1) | 34 (23.5) | 0.738 | 21 (19.1) | 20 (28.2) | 21 (26.2) | 0.528 |
| 4 | 107 (41.0) | 50 (43.1) | 57 (39.3) | 51 (46.4) | 26 (36.6) | 30 (37.5) | ||
| 5 | 92 (35.2) | 38 (32.8) | 54 (37.2) | 38 (34.5) | 25 (35.2) | 29 (36.3) | ||
| Residence area | ||||||||
| Big city | 171 (65.5) | 72 (62.1) | 99 (68.3) | 0.295 | 72 (65.5) | 49 (69.0) | 50 (62.5) | 0.702 |
| Small city, rural area | 90 (34.5) | 44 (37.9) | 46 (31.7) | 38 (34.5) | 22 (31.0) | 30 (37.5) | ||
| Daytime caregiver | ||||||||
| Parents, grandparents | 81 (31.0) | 28 (24.1) | 53 (36.6) | 0.031 | 38 (34.5) | 15 (21.1) | 28 (35.0) | 0.107 |
| Child care teacher | 180 (69.0) | 88 (75.9) | 92 (63.4) | 72 (65.5) | 56 (78.9) | 52 (65.0) | ||
| Meal duration (minutes) | 32.0 ± 13.1 | 31.0 ± 12.1 | 32.8 ± 13.8 | 0.273 | 30.6 ± 12.9b | 30.3 ± 11.5b | 35.5 ± 14.2a | 0.017 |
| Sleep duration (hours) | 9.5 ± 0.9 | 9.7 ± 0.9 | 9.4 ± 0.9 | 0.009 | 9.7 ± 0.8a | 9.5 ± 0.9ab | 9.3 ± 0.9b | 0.037 |
| BMI (kg/m2) | 16.1 ± 1.9 | 15.9 ± 2.0 | 16.2 ± 1.9 | 0.273 | 15.9 ± 1.8 | 16.4 ± 2.0 | 16.2 ± 2.1 | 0.192 |
| BMI category |
||||||||
| Underweight | 15 (5.7) | 5 (4.3) | 10 (6.9) | 0.272 | 7 (6.4) | 3 (4.2) | 5 (6.2) | 0.160 |
| Normal weight | 186 (71.3) | 86 (74.1) | 100 (69.0) | 82 (74.5) | 45 (63.4) | 59 (73.8) | ||
| Overweight | 15 (5.7) | 9 (7.8) | 6 (4.1) | 8 (7.3) | 6 (8.5) | 1 (1.2) | ||
| Obesity | 45 (17.3) | 16 (13.8) | 29 (20.0) | 13 (11.8) | 17 (23.9) | 15 (18.8) | ||
| Total (n = 261) | Screen time |
Mealtime media use |
||||||||
|---|---|---|---|---|---|---|---|---|---|---|
| < 2 hours (n = 116) | ≥ 2 hours (n = 145) | P-value |
Adjusted P-value |
No (n = 110) | Sometimes (n = 71) | Yes (n = 80 | P-value |
Adjusted P-value |
||
| NQ-P score |
||||||||||
| Balance | 62.7 ± 11.8 (55.3 – 70.9) | 63.3 ± 10.4 (54.8 – 71.0) | 62.1 ± 12.8 (55.6 – 70.8) | 0.409 | 0.337 | 63.8 ± 11.9 (56.9 – 71.6) | 62.4 ± 12.8 (54.5 – 71.0) | 61.4 ± 10.7 (54.1 – 69.3) | 0.382 | 0.328 |
| Moderation | 50.7 ± 16.0 (38.9 – 61.1) | 55.2 ± 15.5 (44.0 – 65.6) | 47.2 ± 15.5 (34.0 – 56.6) | < 0.001 | < 0.001 | 55.6 ± 15.4a (44.5 – 66.3) | 47.8 ± 15.6b (37.1 – 60.7) | 46.6 ± 15.5b (33.4 – 55.4) | < 0.001 | < 0.001 |
| Environment | 62.0 ± 18.8 (48.3 – 76.7) | 68.5 ± 18.3 (54.1 – 83.4) | 56.9 ± 17.6 (43.3 – 68.9) | < 0.001 | < 0.001 | 68.9 ± 17.8a (56.8 – 82.8) | 58.4 ± 17.9b (45.3 – 71.9) | 55.9 ± 18.0b (41.4 – 68.7) | < 0.001 | < 0.001 |
| Overall | 58.9 ± 9.5 (52.5 – 64.8) | 62.2 ± 8.9 (54.8 – 68.6) | 56.3 ± 9.2 (51.0 – 62.3) | < 0.001 | < 0.001 | 62.6 ± 9.5a (57.5 – 69.1) | 57.0 ± 9.5b (52.1 – 62.7) | 55.6 ± 7.6b (50.4 – 60.7) | < 0.001 | < 0.001 |
| Assessment result |
||||||||||
| Good (≥ 65) | 65 (24.9) | 45 (38.8) | 20 (13.8) | < 0.001 | 44 (40.0) | 15 (21.1) | 6 (7.5) | < 0.001 | ||
| Monitoring required (< 65) | 196 (75.1) | 71 (61.2) | 125 (86.2) | 66 (60.0) | 56 (78.9) | 74 (92.5) | ||||
| Total (n = 261) | Screen time |
Mealtime media use |
||||||||
|---|---|---|---|---|---|---|---|---|---|---|
| < 2 hours (n = 116) | ≥ 2 hours (n = 145) | P-value |
Adjusted P-value |
No (n = 110) | Sometimes (n = 71) | Yes (n = 80) | P-value |
Adjusted P-value |
||
| Balance | ||||||||||
| White milk | 8.1 ± 6.3 | 7.9 ± 5.7 | 8.2 ± 6.8 | 0.709 | 0.646 | 7.8 ± 5.9 | 8.6 ± 7.3 | 8.0 ± 5.8 | 0.693 | 0.660 |
| Meat | 3.6 ± 1.9 | 3.6 ± 1.6 | 3.6 ± 2.1 | 0.884 | 0.965 | 3.6 ± 1.8 | 3.4 ± 1.8 | 3.8 ± 2.1 | 0.452 | 0.445 |
| Fish | 1.7 ± 1.4 | 1.6 ± 1.4 | 1.7 ± 1.5 | 0.311 | 0.391 | 1.7 ± 1.4 | 1.7 ± 1.4 | 1.5 ± 1.4 | 0.452 | 0.430 |
| Beans and bean products | 2.1 ± 1.8 | 2.1 ± 1.7 | 2.1 ± 2.0 | 0.757 | 0.987 | 2.2 ± 1.8 | 2.1 ± 2.0 | 1.9 ± 1.8 | 0.552 | 0.465 |
| Fruits |
5.1 ± 3.5 | 5.4 ± 3.6 | 4.8 ± 3.4 | 0.228 | 0.296 | 5.4 ± 3.3 | 4.5 ± 3.3 | 5.2 ± 3.8 | 0.234 | 0.269 |
| Vegetables (except kimchi) |
11.8 ± 7.3 | 13.1 ± 6.8 | 10.7 ± 7.6 | 0.009 | 0.008 | 12.8 ± 7.1 | 11.5 ± 7.8 | 10.6 ± 7.0 | 0.117 | 0.134 |
| Kimchi |
10.6 ± 7.8 | 12.9 ± 7.4 | 8.8 ± 7.7 | < 0.001 | < 0.001 | 12.6 ± 7.1a | 11.0 ± 8.0a | 7.5 ± 7.8b | < 0.001 | < 0.001 |
| Moderation | ||||||||||
| Confectionery | 4.5 ± 3.5 | 3.5 ± 2.9 | 5.3 ± 3.7 | < 0.001 | < 0.001 | 3.7 ± 3.3b | 4.5 ± 3.6ab | 5.5 ± 3.4a | 0.002 | 0.003 |
| Sugar-sweetened beverages | 1.5 ± 1.7 | 1.1 ± 1.2 | 1.9 ± 1.9 | < 0.001 | < 0.001 | 1.0 ± 1.2b | 1.9 ± 1.8a | 2.0 ± 1.9a | < 0.001 | < 0.001 |
| Processed meat | 1.5 ± 1.4 | 1.3 ± 1.3 | 1.7 ± 1.5 | 0.051 | 0.104 | 1.2 ± 1.2b | 1.8 ± 1.5a | 1.7 ± 1.6a | 0.004 | 0.007 |
| Fast food | 0.4 ± 0.5 | 0.4 ± 0.5 | 0.4 ± 0.4 | 0.424 | 0.666 | 0.4 ± 0.4 | 0.4 ± 0.6 | 0.4 ± 0.3 | 0.666 | 0.728 |
| Total (n = 261) | Screen time |
Mealtime media use |
||||||||
|---|---|---|---|---|---|---|---|---|---|---|
| < 2 hours (n = 116) | ≥ 2 hours (n = 145) | P-value |
Adjusted P-value |
No (n = 110) | Sometimes (n = 71) | Yes (n = 80) | P-value |
Adjusted P-value |
||
| Average screen time (hours/d) | 1.6 ± 0.8 | 0.8 ± 0.3 | 2.3 ± 0.5 | < 0.001 | < 0.001 | 1.3 ± 0.7c | 1.7 ± 0.8b | 2.1 ± 0.7a | < 0.001 | < 0.001 |
| Breakfast frequency (weekly frequency) | 4.4 ± 2.5 | 4.8 ± 2.4 | 4.1 ± 2.6 | 0.029 | 0.024 | 5.0 ± 2.5a | 4.0 ± 2.5b | 4.1 ± 2.6b | 0.008 | 0.007 |
| Eating without moving around |
3.4 ± 1.1 | 3.6 ± 1.0 | 3.3 ± 1.1 | 0.012 | 0.004 | 3.7 ± 1.0a | 3.3 ± 1.0b | 3.2 ± 1.1b | 0.002 | < 0.001 |
| Washing hands before eating |
3.8 ± 0.8 | 4.0 ± 0.8 | 3.6 ± 0.8 | < 0.001 | < 0.001 | 3.9 ± 0.8a | 3.9 ± 0.8a | 3.5 ± 0.9b | 0.003 | 0.004 |
| Parents’ efforts for healthy eating |
3.9 ± 0.7 | 4.1 ± 0.7 | 3.7 ± 0.7 | < 0.001 | < 0.001 | 4.0 ± 0.7a | 3.8 ± 0.7ab | 3.7 ± 0.7b | 0.006 | 0.006 |
| Total (n = 261) | Screen time |
Mealtime media use |
||||||||
|---|---|---|---|---|---|---|---|---|---|---|
| < 2 hours (n = 116) | ≥ 2 hours (n = 145) | P-value |
Adjusted P-value |
No (n = 110) | Sometimes (n = 71) | Yes (n = 80) | P-value |
Adjusted P-value |
||
| Chewing difficulty-hard food | 1.9 ± 0.9 | 1.9 ± 0.8 | 2.0 ± 0.9 | 0.510 | 0.449 | 1.9 ± 0.8 | 1.9 ± 0.8 | 2.0 ± 0.9 | 0.659 | 0.663 |
| Chewing difficulty-chewy food | 2.3 ± 1.0 | 2.2 ± 0.9 | 2.4 ± 1.0 | 0.069 | 0.057 | 2.3 ± 1.0 | 2.3 ± 0.9 | 2.4 ± 1.1 | 0.726 | 0.745 |
| Swallowing difficulty-holding or spitting out food | 2.3 ± 0.9 | 2.1 ± 1.0 | 2.4 ± 0.9 | 0.035 | 0.012 | 2.2 ± 0.9 | 2.2 ± 1.0 | 2.5 ± 1.0 | 0.135 | 0.119 |
| Swallowing difficulty-retching | 2.0 ± 0.8 | 1.8 ± 0.8 | 2.1 ± 0.9 | 0.004 | 0.002 | 2.0 ± 0.9 | 1.9 ± 0.9 | 2.0 ± 0.8 | 0.815 | 0.827 |
| Picky eating | 2.8 ± 1.1 | 2.5 ± 1.0 | 3.0 ± 1.2 | < 0.001 | < 0.001 | 2.6 ± 1.0b | 2.6 ± 1.2b | 3.2 ± 1.2a | < 0.001 | < 0.001 |
| Refusal to eat | 1.7 ± 0.9 | 1.6 ± 0.8 | 1.8 ± 0.9 | 0.053 | 0.033 | 1.6 ± 0.8b | 1.6 ± 0.8b | 2.0 ± 1.0a | 0.009 | 0.008 |
| Not feeding themselves | 2.4 ± 1.1 | 2.2 ± 1.1 | 2.6 ± 1.2 | 0.014 | 0.004 | 2.1 ± 1.0c | 2.5 ± 1.0b | 2.9 ± 1.2a | < 0.001 | < 0.001 |
Table 1. General characteristics of preschoolers by screen media exposure
n (%) or mean ± SD Underweight (weight for age < 5th percentiles), normal weight (5th ≤ BMI for age < 85th percentiles), overweight (85th ≤ BMI for age < 95th percentiles), and obesity (BMI for age ≥ 95th percentiles) based on the 2017 Korean National Growth Chart Values with different superscripts within each row are significantly different at BMI: Body Mass Index
Table 2. NQ-P score and assessment result by screen media exposure
Mean ± SD (25th –75th percentile) or n (%) Maximum score is 100. "Good" represents an NQ-P score of 65 or above, while "monitoring required" represents a score below 65. Values with different superscripts within each row are significantly different at BMI: Body Mass Index
Table 3. Weekly consumption frequency of food group by screen media exposure
Mean ± SD Questions from DST Values with different superscripts within each row are significantly different at BMI: Body Mass Index, DST: Diet Screening Test
Table 4. Environmental factors of NQ-P by screen media exposure
Mean ± SD The responses are based on a 5-point Likert scale, 1 = very unlikely, 2 = unlikely, 3 = neutral, 4 = likely, 5 = very likely. Values with different superscripts within each row are significantly different at BMI: Body Mass Index
Table 5. Feeding difficulties1) by screen media exposure
Mean ± SD The responses are based on a 5-point Likert scale, 1 = very unlikely, 2 = unlikely, 3 = neutral, 4 = likely, 5 = very likely. Values with different superscripts within each row are significantly different at BMI: Body Mass Index


