
Articles
- Page Path
- HOME > Korean J Community Nutr > Volume 20(6); 2015 > Article
-
Research Article
- The Relationships among Quality of Life and Stress, Health-related Habits and Food Intake in Korean Healthy Adults Based on 2013 Korea National Health and Nutrition Examination Survey
- Su Bin Lee, Hyun Jin Choi, Mi Joung Kim
-
Korean Journal of Community Nutrition 2015;20(6):411-422.
DOI: https://doi.org/10.5720/kjcn.2015.20.6.411
Published online: December 31, 2015
Department of Food and Nutrition, College of Natural Sciences, Seoul Women's University, Seoul, Korea.
- Corresponding author: Mi Joung Kim. Department of Food and Nutrition, College of Natural Sciences, Seoul Women's University, 621, Hwarang-ro, Nowon-gu, Seoul 01797, Korea. Tel: (02) 970-5644, Fax: (02) 976-4049, kmjoung@swu.ac.kr
• Received: October 14, 2015 • Revised: December 13, 2015 • Accepted: December 24, 2015
Copyright © 2015 The Korean Society of Community Nutrition
This is an Open-Access article distributed under the terms of the Creative Commons Attribution Non-Commercial License (http://creativecommons.org/licenses/by-nc/3.0/) which permits unrestricted non-commercial use, distribution, and reproduction in any medium, provided the original work is properly cited.
- 1,647 Views
- 1 Download
- 3 Crossref
Abstract
-
Objectives
- This study investigated the socioeconomic factors that affect quality of life (QL) in healthy adults and to study the relationship between QL and health-related habits and food intake.
-
Methods
- Subjects consisted of 1,154 healthy adults without any known disease, aged 19 to 65 years from the 2013 Korean National Health and Nutrition Examination Survey data. We used SPSS statistical program version 20.0 for data analysis.
-
Results
- The average age and QL score of the study population were 36.7 years and 0.99 points, respectively. Males had a significantly higher QL score than the females (p < 0.001), and employed subjects and those employed in permanent positions had significantly higher scores as compared respectively with unemployed subjects and those employed in temporary positions (p < 0.001, p < 0.05). The group that responded "almost every day" to the "frequency of binge drinking" and "frequency of disruption of daily life due to drinking" had significantly lower QL scores as compared to other groups (p < 0.05). Further, the scores were significantly higher for individuals who practiced "intense physical activities" and "walking" (p < 0.001). The groups that responded that they were "very stressed" showed significantly lower QL scores in comparison to the other groups (p < 0.05). There were no significant differences in QL scores according to anthropometric or biochemical indices. When subjects were divided into two groups based on average QL scores, the frequency of intake of "barbecued beef" was significantly higher while the frequency of intake of "fried eggs or rolled omelet," and "soy milk" was significantly lower in the high QL group.
-
Conclusions
- Based on these findings, it is evident that in healthy adults without any known underlying illnesses, psychological factors such as economic activity, occupational environment, and stress are considered to have a greater impact on their QL than are nutrient intake, blood biochemical indices, and anthropometric status.
Acknowledgments
Acknowledgments
- 1. Gerin P, Dazord A, Boissel J, Chifflet R. Quality of life assessment in therapeutic trials: rationale for and presentation of a more appropriate instrument. Fundam Clin Pharmacol 1992; 6(6): 263-276.ArticlePubMed
- 2. Wallander JL, Varni JW. Effects of pediatric chronic physical disorders on child and family adjustment. J Child Psychol Psychiatry 1998; 39(1): 29-46.ArticlePubMed
- 3. Bergner M. Quality of life, health status, and clinical research. Med Care 1989; 27(3): S148-S156.ArticlePubMed
- 4. Walker SN, Volkan K, Sechrist KR, Pender NJ. Healthpromoting life styles of older adults: comparisons with young and middle-aged adults, correlates and patterns. ANS Adv Nurs Sci 1988; 11(1): 76-90.PubMed
- 5. Sohn S. Factors related to the health related quality of life in elderly women. Korean J Women Health Nurs 2009; 15(2): 99-107.Article
- 6. Brzyski RG, Medrano MA, Hyatt-Santos JM, Ross JS. Quality of life in low-income menopausal women attending primary care clinics. Fertil Steril 2001; 76(1): 44-50.ArticlePubMed
- 7. McEwen LN, Kim C, Haan MN, Ghosh D, Lantz PM, Thompson TJ. Are health-related quality-of-life and selfrated health associated with mortality? Insights from Translating Research Into Action for Diabetes (TRIAD). Prim Care Diabetes 2009; 3(1): 37-42.ArticlePubMedPMC
- 8. Drewnowski A, Evans WJ. Nutrition, physical activity, and quality of life in older adults: summary. J Gerontol A Biol Sci Med Sci 2001; 56: Suppl 2. 89-94.ArticlePubMed
- 9. Pollak LO, McCune AM, Mandal K, Lundgren JD. Quantitative and qualitative analysis of the quality of life of individuals with eating disorders. Prim Care Companion CNS Disord 2015; 17(2):
- 10. Kim HR, Oh K, Oh KO, Lee SO, Lee SJ, Kim JA. Quality of life in low income Korean aged. J Korean Acad Nurs 2008; 38(5): 694-703.ArticlePubMed
- 11. Jakobsson U, Hallberg IR, Westergren A. Overall and health related quality of life among the oldest old in pain. Qual Life Res 2004; 13(1): 125-136.ArticlePubMed
- 12. Kim YM, Hyeon SH, Song HS. The relationship among health status, health promoting behavior, depression and quality of life of health program participants. J Leis Recreation Stud 2008; 32(4): 33-46.
- 13. Rabin R, de Charro F. EQ-5D: a measure of health status from the EuroQol group. Ann Med 2001; 33(5): 337-343.PubMed
- 14. Kang EJ, Shin HS, Park HJ, Jo MW, Kim NY. A valuation of health status using EQ-5D. Korean J Health Econ Policy 2006; 12(2): 19-43.
- 15. Kim MK, Lee WY, Kang JH, Kim SM, Kim EM. 2014 clinical practice guidelines for overweight and obesity in Korea. Korean J Obes 2014; 23(4): 217-221.Article
- 16. Alberti KG, Eckel RH, Grundy SM, Zimmet PZ, Cleeman JI, Donato KA. Harmonizing the metabolic syndrome: a joint interim statement of the international diabetes federation task force on epidemiology and prevention; national heart, lung, and blood institute; American heart association; world heart federation; international atherosclerosis society; and international association for the study of obesity. Circulation 2009; 120(16): 1640-1645.ArticlePubMed
- 17. Lee SY, Park HS, Kim DJ, Han JH, Kim SM, Cho GJ. Appropriate waist circumference cutoff points for central obesity in Korean adults. Diabetes Res Clin Pract 2007; 75(1): 72-80.ArticlePubMed
- 18. The Koran Nutrition Society. Dietary reference intakes for Koreans 2010 [Internet]. The Korean Nutrition Society; 2010; cited 2010 Oct 29]. Available from: http://www.kns.or.kr/.
- 19. Chung JY, Lee MY, Kim MJ. A study on the prevalence of chronic diseases, health-related habits and nutrients intakes according to the quality of life in Korean adults. Korean J Community Nutr 2010; 15(4): 445-459.
- 20. Lee YW. A study of quality of life in middle-aged men. J Korean Acad Nurs 2002; 32(4): 539-549.ArticleLink
- 21. Bowman S. Low economic status is associated with suboptimal intakes of nutritious foods by adults in the national health and nutrition examination survey 1999-2002. Nutr Res 2007; 27(9): 515-523.Article
- 22. Kwon MA, Kim TH. A study on the satisfaction with life for the elderly-comparison study of volunteer work group and economic activities group. J Korean Gerontol Soc 2008; 28(4): 1089-1111.
- 23. Jun EM, Cho DS. The relationship of symptoms of stress, cancer prevention behavior and the quality of life in women. Korean J Women Health Nurs 2005; 11(2): 156-162.ArticleLink
- 24. Kim EJ, Oh KJ, Ha EH. The vulnerability of married women on depression: Focused on life stress and coping processes. Korean J Woman Psychol 1999; 4(1): 1-14.
- 25. Lin QL, Kim HK, Ann JS. Relationship between depression and quality of life in elderly women living alone: The moderating and mediating effects of social support and social activity. J Korean Gerontol Soc 2011; 31(1): 33-47.
- 26. Lee DH. The effects of quality of life in the elderly's health condition. J Korean Gerontol Soc 2010; 30(1): 93-108.
- 27. Okoro CA, Brewer RD, Naimi TS, Moriarty DG, Giles WH, Mokdad AH. Binge drinking and health-related quality of life: do popular perceptions match reality? Am J Prev Med 2004; 26(3): 230-233.PubMed
- 28. Bae SY, Ko DS, Noh JS, Lee BH, Park HS, Park J. Relation of physical activity and health-related quality of life in Korean elderly. J Korea Contents Assoc 2010; 10(10): 255-266.Article
REFERENCES

Table 2
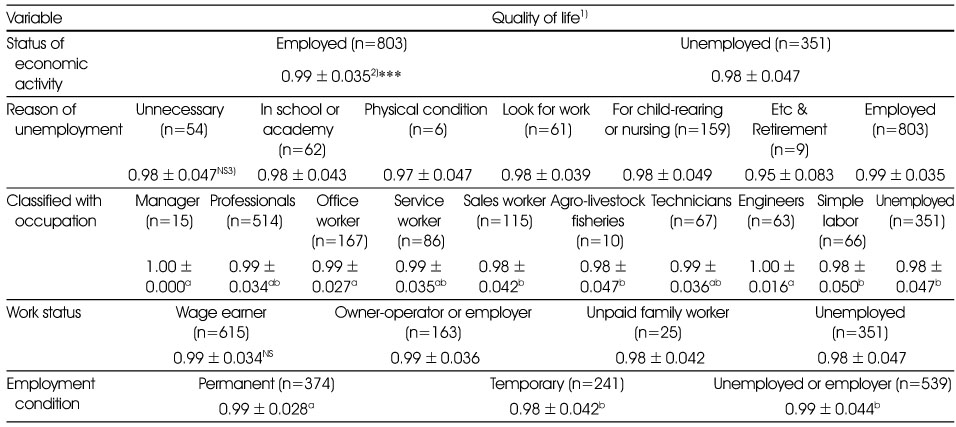
Quality of life by occupations and the status of economic activity of Korean healthy adults
1) Quality of life are represented as Euro Quality of life-5 dimension (EQ-5D) index.
2) Mean±SD
3) NS: not significantly different among groups
***: p < 0.001 by t-test in complex sample survey data analysis
a, b: Means with different superscript letters are significantly different from each other at p < 0.05 by least significant difference multiple range test in complex sample survey data analysis.
Table 3
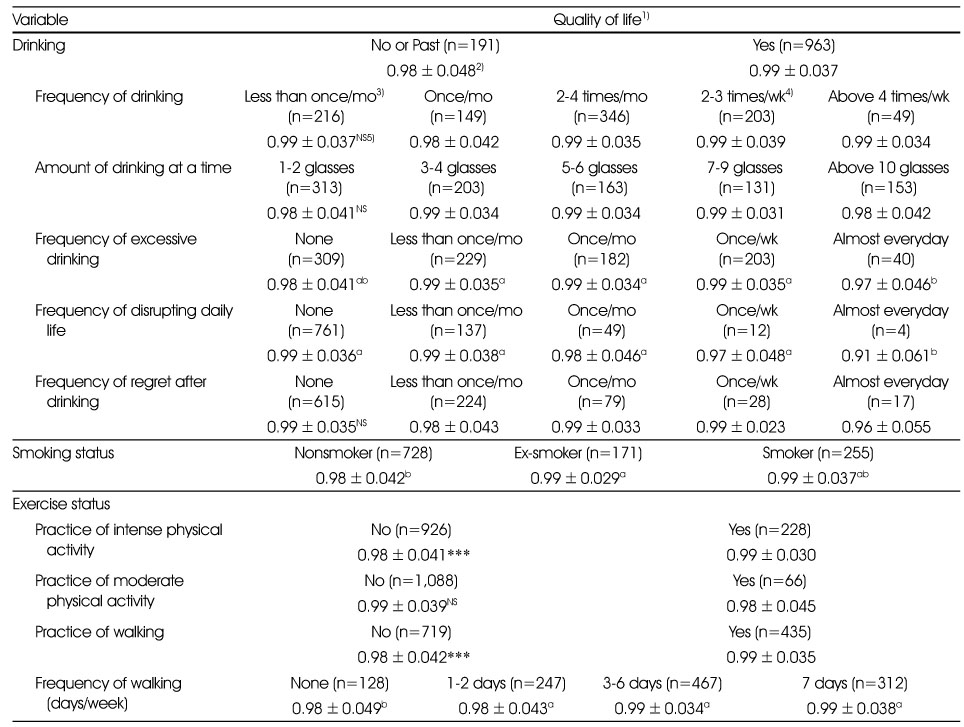
Quality of life by health related habits of Korean healthy adults
1) Quality of life are represented as Euro Quality of life-5 dimension (EQ-5D) index.
2) Mean±SD
3) mo: month
4) wk: week
5) NS: not significantly different among groups
***: p < 0.001 by t-test in complex sample survey data analysis
a,b: Means with different superscript letters are significantly different from each other at p < 0.05 by least significant difference multiple range test in complex sample survey data analysis.
Table 4

Quality of life by psychological status of Korean healthy adults
1) Quality of life are represented as Euro Quality of life-5 dimension (EQ-5D) index.
2) Mean±SD
***: p < 0.001 by t-test in complex sample survey data analysis
a,b: Means with different superscript letters are significantly different from each other at p < 0.05 by least significant difference multiple range test in complex sample survey data analysis.
Table 5

Quality of life by subjective consciousness of Korean healthy adults
1) Quality of life are represented as Euro Quality of life-5 dimension (EQ-5D) index.
2) Mean±SD
3) NS: not significantly different among groups
a,b,c: Means with different superscript letters are significantly different from each other at p < 0.05 by least significant difference multiple range test in complex sample survey data analysis.
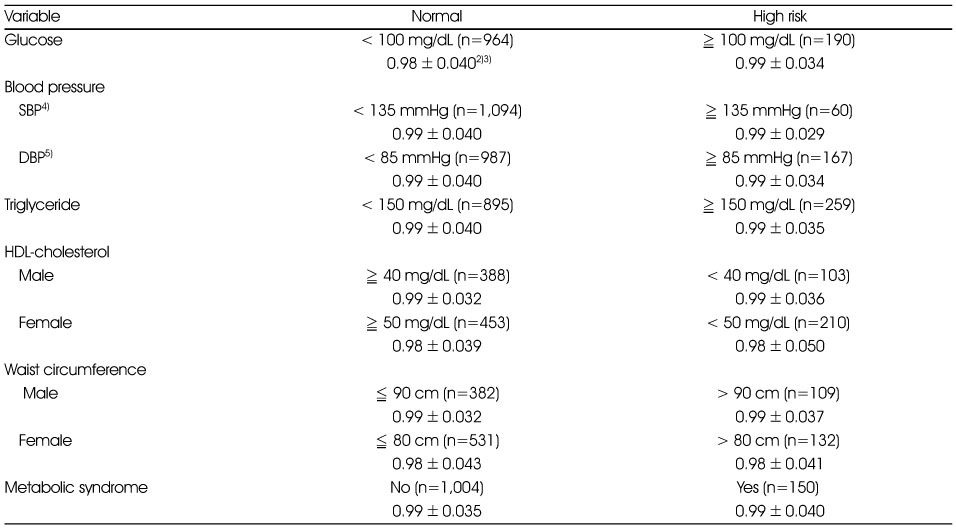
Table 7

Nutritional intakes by low or high quality of life groups in Korean healthy adults
1) Low QL: low quality of life index group
2) High QL: high quality of life index group
3) EAR: Estimated Average Requirement, except Energy; except Energy (less than 75% of estimated energy requirement)
4) RNI: Recommended Nutrient Intake, except Energy; except Energy (over than 125% of estimated energy requirement)
5) Mean±SD
6) N (%)
***: p < 0.001
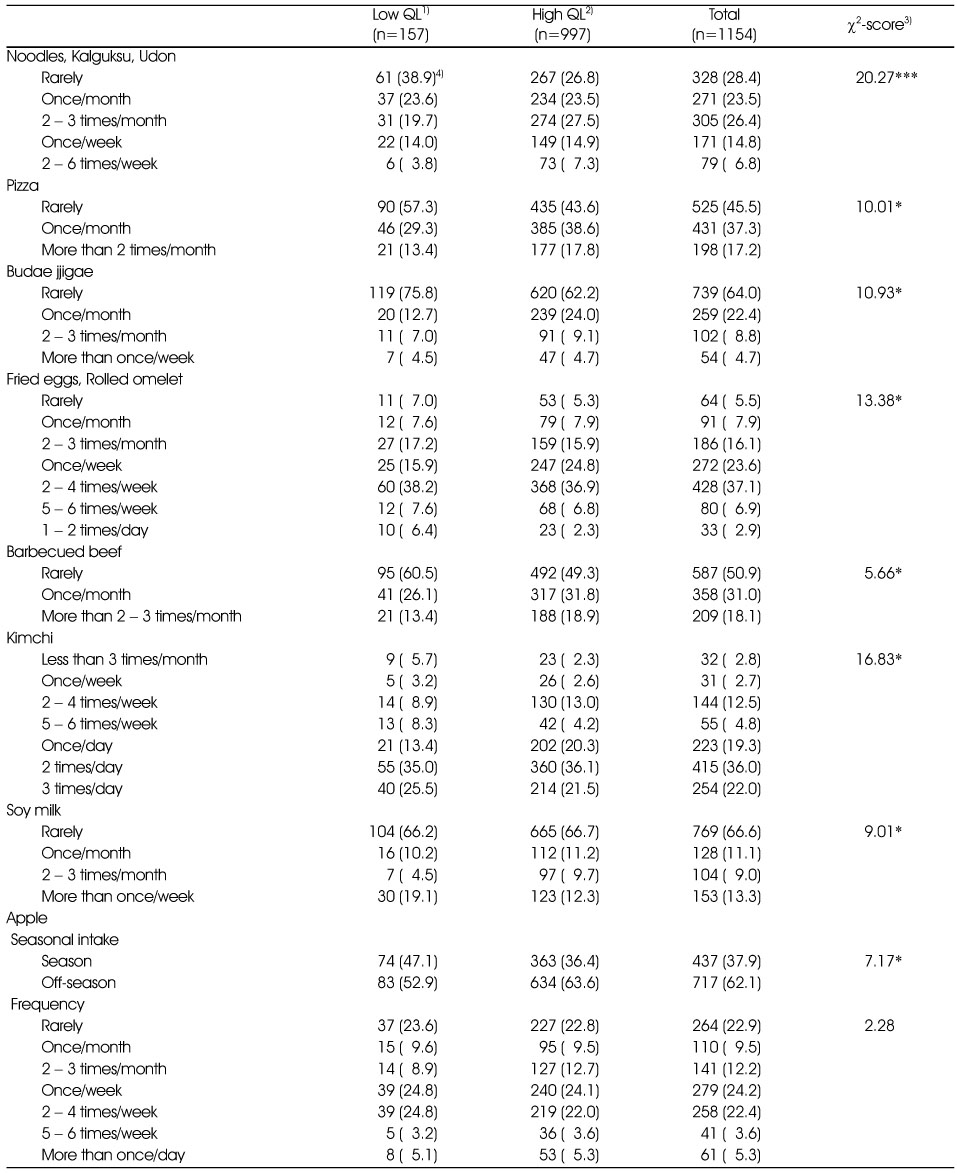
Figure & Data
REFERENCES
Citations
Citations to this article as recorded by 
- Study on the relationship between dietary habits and the quality of life of some high school students in Seoul based on the nutrition quotient for adolescents (NQ-A)
Ho-Jung Kim, Jung-Sug Lee, Yookyung Kim
Journal of Nutrition and Health.2024; 57(3): 320. CrossRef - DOES HEALTH LITERACY AND LIFE SATISFACTION PROMOTE HEALTHY EATING AMONG MARRIED WOMEN IN TURKEY?
Mahmut Kılıç, Nurgül Nehir Yılmaz
Eskişehir Türk Dünyası Uygulama ve Araştırma Merkezi Halk Sağlığı Dergisi.2024; 9(3): 323. CrossRef - The Connection between Hand Washing and Brushing Teeth
Ra-Ae Bak, Sun-Jung Shin, Hee-Jung Park, Jin-Young Jung, Hwa-Young Lee, Nam-Hee Kim
Journal of Dental Hygiene Science.2023; 23(2): 132. CrossRef
 Cite
Cite- We recommend
- Related articles
-
- Association between nutrient intake and frailty status in Korean older adults: a cross-sectional study using the 9th (2022–2023) Korea National Health and Nutrition Examination Survey
- Ultra-processed food intake and dietary behaviors in Korean adolescents: a cross-sectional study based on the 2019–2023 Korea National Health and Nutrition Examination Survey
- Analysis of the relationship between sugar intake and cancer prevalence: a cross-sectional study using the 8th Korea National Health and Nutrition Examination Survey
- Trends in growth and nutritional status of Korean toddlers and preschoolers: a cross-sectional study using 2010–2021 Korea National Health and Nutrition Examination Survey data
- Total sugar intake and its contributed foods by age groups in Koreans using the 8th (2019–2021) Korea National Health and Nutrition Examination Survey: a cross-sectional study
The Relationships among Quality of Life and Stress, Health-related Habits and Food Intake in Korean Healthy Adults Based on 2013 Korea National Health and Nutrition Examination Survey
The Relationships among Quality of Life and Stress, Health-related Habits and Food Intake in Korean Healthy Adults Based on 2013 Korea National Health and Nutrition Examination Survey
Quality of life by general characteristics of Korean healthy adults
1) Quality of life are represented as Euro Quality of life-5 dimension (EQ-5D) index.
2) Mean±SD
3) NS: not significantly different among groups
***: p < 0.001 by t-test in complex sample survey data analysis
Quality of life by occupations and the status of economic activity of Korean healthy adults
1) Quality of life are represented as Euro Quality of life-5 dimension (EQ-5D) index.
2) Mean±SD
3) NS: not significantly different among groups
***: p < 0.001 by t-test in complex sample survey data analysis
a, b: Means with different superscript letters are significantly different from each other at p < 0.05 by least significant difference multiple range test in complex sample survey data analysis.
Quality of life by health related habits of Korean healthy adults
1) Quality of life are represented as Euro Quality of life-5 dimension (EQ-5D) index.
2) Mean±SD
3) mo: month
4) wk: week
5) NS: not significantly different among groups
***: p < 0.001 by t-test in complex sample survey data analysis
a,b: Means with different superscript letters are significantly different from each other at p < 0.05 by least significant difference multiple range test in complex sample survey data analysis.
Quality of life by psychological status of Korean healthy adults
1) Quality of life are represented as Euro Quality of life-5 dimension (EQ-5D) index.
2) Mean±SD
***: p < 0.001 by t-test in complex sample survey data analysis
a,b: Means with different superscript letters are significantly different from each other at p < 0.05 by least significant difference multiple range test in complex sample survey data analysis.
Quality of life by subjective consciousness of Korean healthy adults
1) Quality of life are represented as Euro Quality of life-5 dimension (EQ-5D) index.
2) Mean±SD
3) NS: not significantly different among groups
a,b,c: Means with different superscript letters are significantly different from each other at p < 0.05 by least significant difference multiple range test in complex sample survey data analysis.
Quality of life1) by metabolic syndrome factors of Korean healthy adults
1) Quality of life are represented as Euro Quality of life-5 dimension (EQ-5D) index.
2) Mean±SD
3) All data are not significantly different among groups.
4) SBP: systolic blood pressure
5) DBP: diastolic blood pressure
Nutritional intakes by low or high quality of life groups in Korean healthy adults
1) Low QL: low quality of life index group
2) High QL: high quality of life index group
3) EAR: Estimated Average Requirement, except Energy; except Energy (less than 75% of estimated energy requirement)
4) RNI: Recommended Nutrient Intake, except Energy; except Energy (over than 125% of estimated energy requirement)
5) Mean±SD
6) N (%)
***: p < 0.001
Food intake frequency by low or high quality of life groups in Korean healthy adults
1) Low QL: low quality of life index group
2) High QL: high quality of life index group
3) χ2-scores are by Pearson's chi-square test in complex sample survey data analysis.
4) N (%)
*: p < 0.05, ***: p < 0.001
Table 1
Quality of life by general characteristics of Korean healthy adults
1) Quality of life are represented as Euro Quality of life-5 dimension (EQ-5D) index. 2) Mean±SD 3) NS: not significantly different among groups ***: p < 0.001 by t-test in complex sample survey data analysis
Table 2
Quality of life by occupations and the status of economic activity of Korean healthy adults
1) Quality of life are represented as Euro Quality of life-5 dimension (EQ-5D) index. 2) Mean±SD 3) NS: not significantly different among groups ***: p < 0.001 by t-test in complex sample survey data analysis a, b: Means with different superscript letters are significantly different from each other at p < 0.05 by least significant difference multiple range test in complex sample survey data analysis.
Table 3
Quality of life by health related habits of Korean healthy adults
1) Quality of life are represented as Euro Quality of life-5 dimension (EQ-5D) index. 2) Mean±SD 3) mo: month 4) wk: week 5) NS: not significantly different among groups ***: p < 0.001 by t-test in complex sample survey data analysis a,b: Means with different superscript letters are significantly different from each other at p < 0.05 by least significant difference multiple
range test in complex sample survey data analysis.
Table 4
Quality of life by psychological status of Korean healthy adults
1) Quality of life are represented as Euro Quality of life-5 dimension (EQ-5D) index. 2) Mean±SD ***: p < 0.001 by t-test in complex sample survey data analysis a,b: Means with different superscript letters are significantly different from each other at p < 0.05 by least significant difference multiple range test in complex sample survey data analysis.
Table 5
Quality of life by subjective consciousness of Korean healthy adults
1) Quality of life are represented as Euro Quality of life-5 dimension (EQ-5D) index. 2) Mean±SD 3) NS: not significantly different among groups a,b,c: Means with different superscript letters are significantly different from each other at p < 0.05 by least significant difference multiple range test in complex sample survey data analysis.
Table 6
Quality of life1) by metabolic syndrome factors of Korean healthy adults
1) Quality of life are represented as Euro Quality of life-5 dimension (EQ-5D) index. 2) Mean±SD 3) All data are not significantly different among groups. 4) SBP: systolic blood pressure 5) DBP: diastolic blood pressure
Table 7
Nutritional intakes by low or high quality of life groups in Korean healthy adults
1) Low QL: low quality of life index group 2) High QL: high quality of life index group 3) EAR: Estimated Average Requirement, except Energy; except Energy (less than 75% of estimated energy requirement) 4) RNI: Recommended Nutrient Intake, except Energy; except Energy (over than 125% of estimated energy requirement) 5) Mean±SD 6) N (%) ***: p < 0.001
Table 8
Food intake frequency by low or high quality of life groups in Korean healthy adults
1) Low QL: low quality of life index group 2) High QL: high quality of life index group 3) χ2-scores are by Pearson's chi-square test in complex sample survey data analysis. 4) N (%) *: p < 0.05, ***: p < 0.001


