Articles
- Page Path
- HOME > Korean J Community Nutr > Volume 20(6); 2015 > Article
-
Research Article
- The Relationships among Quality of Life and Stress, Health-related Habits and Food Intake in Korean Healthy Adults Based on 2013 Korea National Health and Nutrition Examination Survey
- Su Bin Lee, Hyun Jin Choi, Mi Joung Kim
-
Korean Journal of Community Nutrition 2015;20(6):411-422.
DOI: https://doi.org/10.5720/kjcn.2015.20.6.411
Published online: December 31, 2015
Department of Food and Nutrition, College of Natural Sciences, Seoul Women's University, Seoul, Korea.
- Corresponding author: Mi Joung Kim. Department of Food and Nutrition, College of Natural Sciences, Seoul Women's University, 621, Hwarang-ro, Nowon-gu, Seoul 01797, Korea. Tel: (02) 970-5644, Fax: (02) 976-4049, kmjoung@swu.ac.kr
Copyright © 2015 The Korean Society of Community Nutrition
This is an Open-Access article distributed under the terms of the Creative Commons Attribution Non-Commercial License (http://creativecommons.org/licenses/by-nc/3.0/) which permits unrestricted non-commercial use, distribution, and reproduction in any medium, provided the original work is properly cited.
- 1,312 Views
- 1 Download
- 3 Crossref
Figure & Data
REFERENCES
Citations

- Study on the relationship between dietary habits and the quality of life of some high school students in Seoul based on the nutrition quotient for adolescents (NQ-A)
Ho-Jung Kim, Jung-Sug Lee, Yookyung Kim
Journal of Nutrition and Health.2024; 57(3): 320. CrossRef - DOES HEALTH LITERACY AND LIFE SATISFACTION PROMOTE HEALTHY EATING AMONG MARRIED WOMEN IN TURKEY?
Mahmut Kılıç, Nurgül Nehir Yılmaz
Eskişehir Türk Dünyası Uygulama ve Araştırma Merkezi Halk Sağlığı Dergisi.2024; 9(3): 323. CrossRef - The Connection between Hand Washing and Brushing Teeth
Ra-Ae Bak, Sun-Jung Shin, Hee-Jung Park, Jin-Young Jung, Hwa-Young Lee, Nam-Hee Kim
Journal of Dental Hygiene Science.2023; 23(2): 132. CrossRef
- We recommend
- Related articles
-
- Ultra-processed food intake and dietary behaviors in Korean adolescents: a cross-sectional study based on the 2019–2023 Korea National Health and Nutrition Examination Survey
- Analysis of the relationship between sugar intake and cancer prevalence: a cross-sectional study using the 8th Korea National Health and Nutrition Examination Survey
- Trends in growth and nutritional status of Korean toddlers and preschoolers: a cross-sectional study using 2010–2021 Korea National Health and Nutrition Examination Survey data
- Total sugar intake and its contributed foods by age groups in Koreans using the 8th (2019–2021) Korea National Health and Nutrition Examination Survey: a cross-sectional study
Quality of life by general characteristics of Korean healthy adults
1) Quality of life are represented as Euro Quality of life-5 dimension (EQ-5D) index.
2) Mean±SD
3) NS: not significantly different among groups
***: p < 0.001 by t-test in complex sample survey data analysis
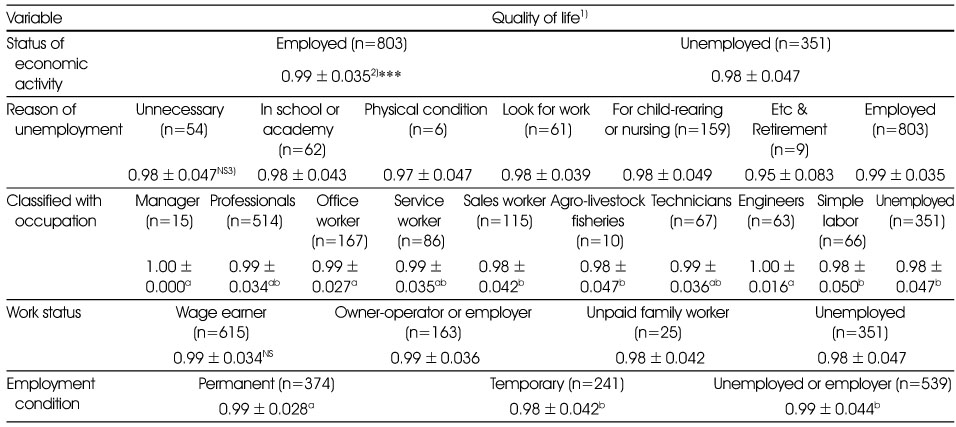
Quality of life by occupations and the status of economic activity of Korean healthy adults
1) Quality of life are represented as Euro Quality of life-5 dimension (EQ-5D) index.
2) Mean±SD
3) NS: not significantly different among groups
***: p < 0.001 by t-test in complex sample survey data analysis
a, b: Means with different superscript letters are significantly different from each other at p < 0.05 by least significant difference multiple range test in complex sample survey data analysis.
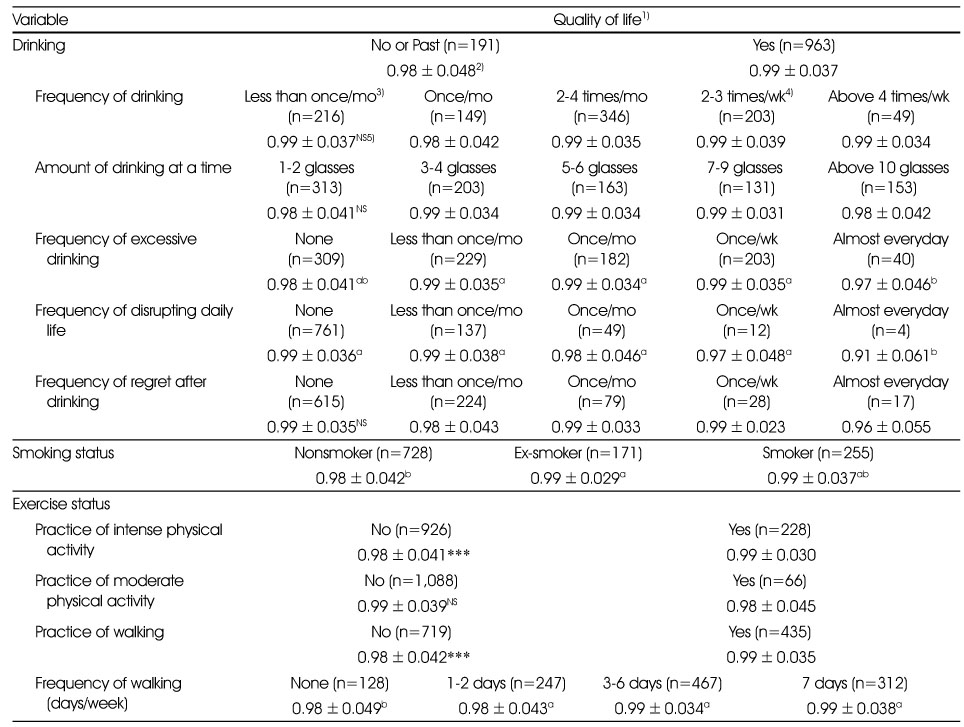
Quality of life by health related habits of Korean healthy adults
1) Quality of life are represented as Euro Quality of life-5 dimension (EQ-5D) index.
2) Mean±SD
3) mo: month
4) wk: week
5) NS: not significantly different among groups
***: p < 0.001 by t-test in complex sample survey data analysis
a,b: Means with different superscript letters are significantly different from each other at p < 0.05 by least significant difference multiple range test in complex sample survey data analysis.
Quality of life by psychological status of Korean healthy adults
1) Quality of life are represented as Euro Quality of life-5 dimension (EQ-5D) index.
2) Mean±SD
***: p < 0.001 by t-test in complex sample survey data analysis
a,b: Means with different superscript letters are significantly different from each other at p < 0.05 by least significant difference multiple range test in complex sample survey data analysis.
Quality of life by subjective consciousness of Korean healthy adults
1) Quality of life are represented as Euro Quality of life-5 dimension (EQ-5D) index.
2) Mean±SD
3) NS: not significantly different among groups
a,b,c: Means with different superscript letters are significantly different from each other at p < 0.05 by least significant difference multiple range test in complex sample survey data analysis.
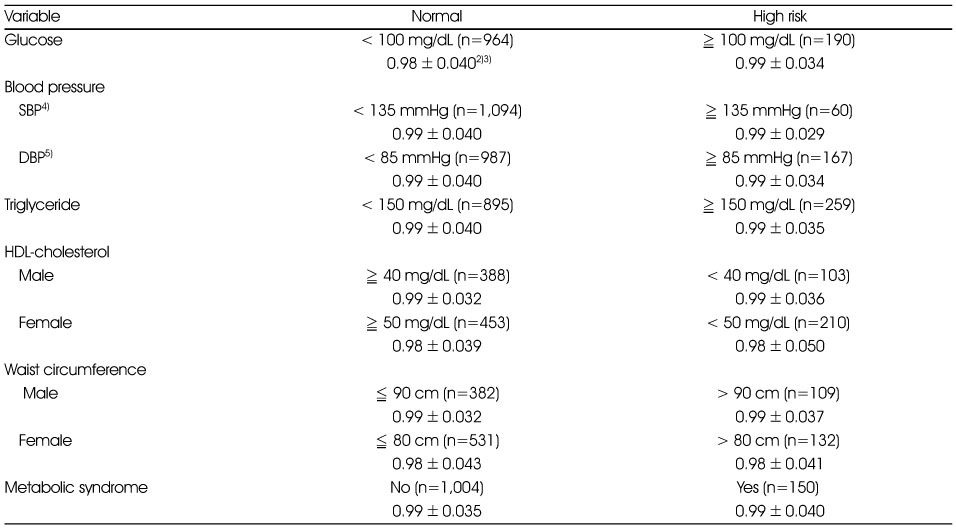
Quality of life1) by metabolic syndrome factors of Korean healthy adults
1) Quality of life are represented as Euro Quality of life-5 dimension (EQ-5D) index.
2) Mean±SD
3) All data are not significantly different among groups.
4) SBP: systolic blood pressure
5) DBP: diastolic blood pressure
Nutritional intakes by low or high quality of life groups in Korean healthy adults
1) Low QL: low quality of life index group
2) High QL: high quality of life index group
3) EAR: Estimated Average Requirement, except Energy; except Energy (less than 75% of estimated energy requirement)
4) RNI: Recommended Nutrient Intake, except Energy; except Energy (over than 125% of estimated energy requirement)
5) Mean±SD
6) N (%)
***: p < 0.001
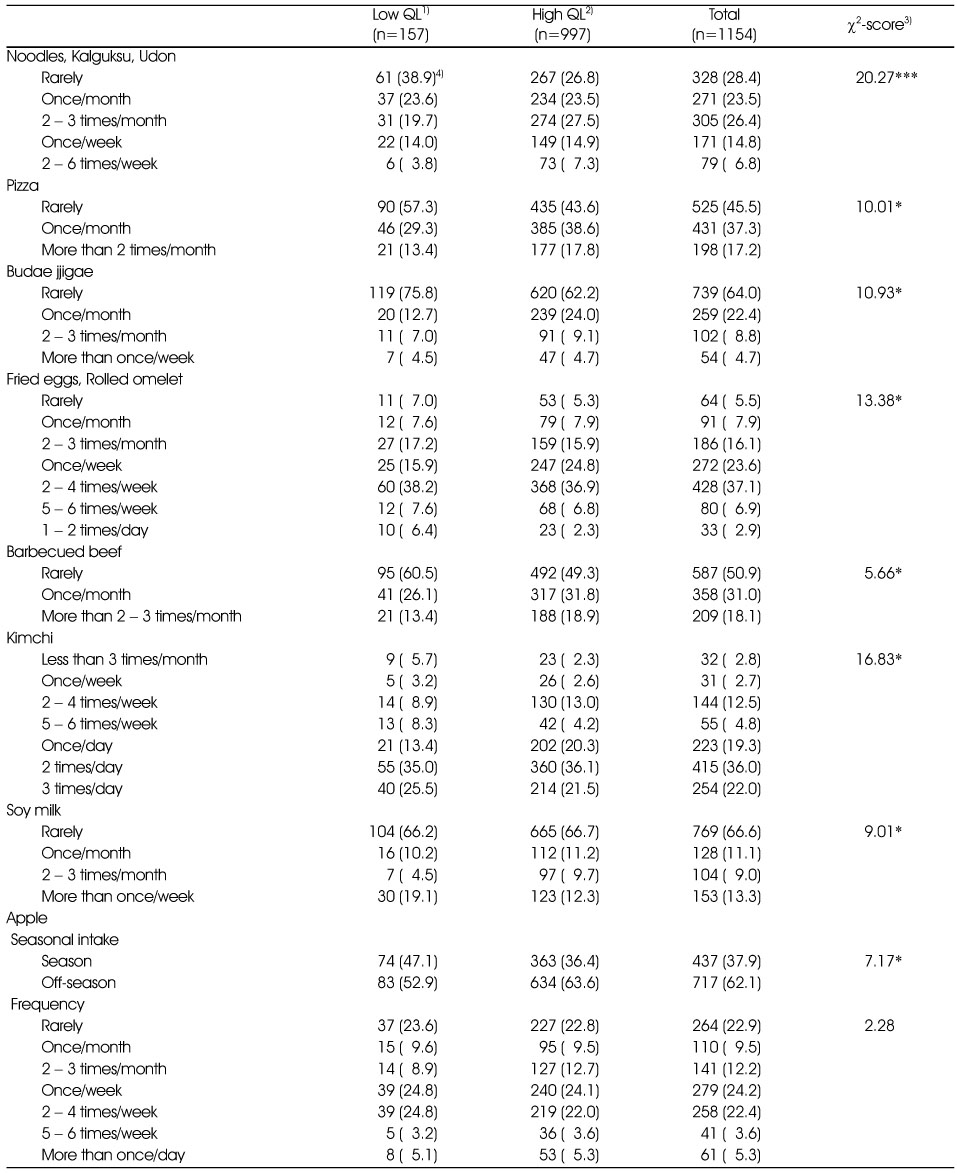
Food intake frequency by low or high quality of life groups in Korean healthy adults
1) Low QL: low quality of life index group
2) High QL: high quality of life index group
3) χ2-scores are by Pearson's chi-square test in complex sample survey data analysis.
4) N (%)
*: p < 0.05, ***: p < 0.001
1) Quality of life are represented as Euro Quality of life-5 dimension (EQ-5D) index. 2) Mean±SD 3) NS: not significantly different among groups ***: p < 0.001 by t-test in complex sample survey data analysis
1) Quality of life are represented as Euro Quality of life-5 dimension (EQ-5D) index. 2) Mean±SD 3) NS: not significantly different among groups ***: p < 0.001 by t-test in complex sample survey data analysis a, b: Means with different superscript letters are significantly different from each other at p < 0.05 by least significant difference multiple range test in complex sample survey data analysis.
1) Quality of life are represented as Euro Quality of life-5 dimension (EQ-5D) index. 2) Mean±SD 3) mo: month 4) wk: week 5) NS: not significantly different among groups ***: p < 0.001 by t-test in complex sample survey data analysis a,b: Means with different superscript letters are significantly different from each other at p < 0.05 by least significant difference multiple
range test in complex sample survey data analysis.
1) Quality of life are represented as Euro Quality of life-5 dimension (EQ-5D) index. 2) Mean±SD ***: p < 0.001 by t-test in complex sample survey data analysis a,b: Means with different superscript letters are significantly different from each other at p < 0.05 by least significant difference multiple range test in complex sample survey data analysis.
1) Quality of life are represented as Euro Quality of life-5 dimension (EQ-5D) index. 2) Mean±SD 3) NS: not significantly different among groups a,b,c: Means with different superscript letters are significantly different from each other at p < 0.05 by least significant difference multiple range test in complex sample survey data analysis.
1) Quality of life are represented as Euro Quality of life-5 dimension (EQ-5D) index. 2) Mean±SD 3) All data are not significantly different among groups. 4) SBP: systolic blood pressure 5) DBP: diastolic blood pressure
1) Low QL: low quality of life index group 2) High QL: high quality of life index group 3) EAR: Estimated Average Requirement, except Energy; except Energy (less than 75% of estimated energy requirement) 4) RNI: Recommended Nutrient Intake, except Energy; except Energy (over than 125% of estimated energy requirement) 5) Mean±SD 6) N (%) ***: p < 0.001
1) Low QL: low quality of life index group 2) High QL: high quality of life index group 3) χ2-scores are by Pearson's chi-square test in complex sample survey data analysis. 4) N (%) *: p < 0.05, ***: p < 0.001

 KSCN
KSCN


 Cite
Cite


